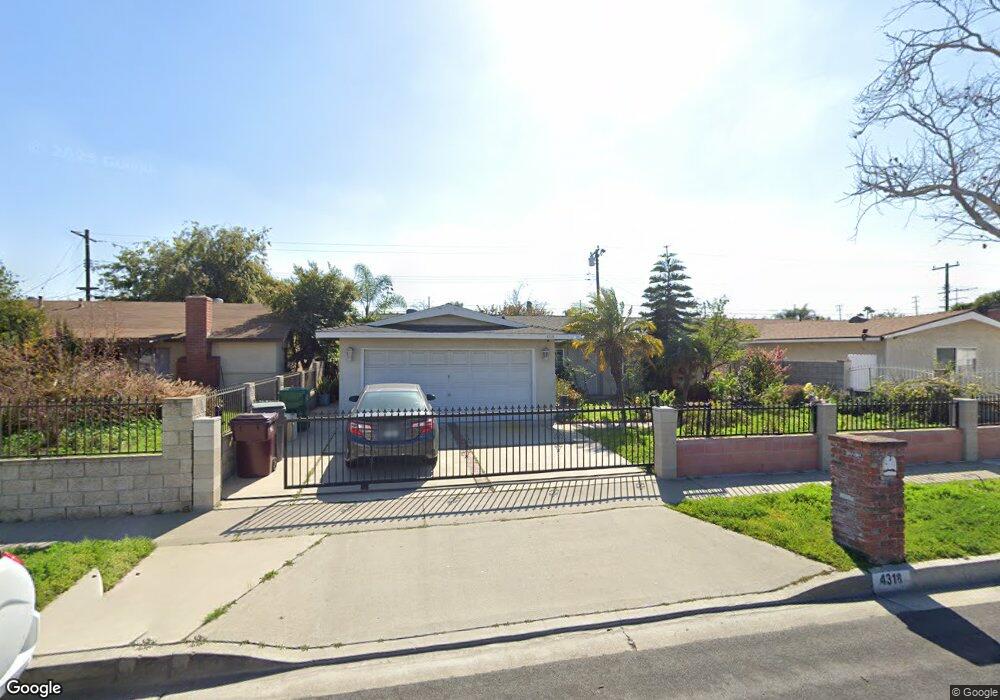
4318 Roosevelt Ave Santa Ana, CA 92703
Riverview West NeighborhoodEstimated Value: $858,000 - $1,136,000
3
Beds
2
Baths
1,494
Sq Ft
$643/Sq Ft
Est. Value
About This Home
This home is located at 4318 Roosevelt Ave, Santa Ana, CA 92703 and is currently estimated at $961,207, approximately $643 per square foot. 4318 Roosevelt Ave is a home located in Orange County with nearby schools including R. F. Hazard Elementary School, James Irvine Intermediate School, and Los Amigos High School.
Ownership History
Date
Name
Owned For
Owner Type
Purchase Details
Closed on
Feb 27, 2009
Sold by
Hsbc Bank Usa National Association
Bought by
Tang Steven Tung and Tang Diana
Current Estimated Value
Purchase Details
Closed on
Nov 21, 2008
Sold by
Lopez Dario and Ocana Ethelvina
Bought by
Hsbc Bank Usa National Association
Purchase Details
Closed on
May 18, 2006
Sold by
Nguyen Linda Minh
Bought by
Lopez Dario and Ocana Ethelvina
Home Financials for this Owner
Home Financials are based on the most recent Mortgage that was taken out on this home.
Original Mortgage
$488,000
Interest Rate
7%
Mortgage Type
Purchase Money Mortgage
Purchase Details
Closed on
Jan 18, 2002
Sold by
Le Tien Duy and Nguyen Anh Ngoc
Bought by
Nguyen Linda Minh
Home Financials for this Owner
Home Financials are based on the most recent Mortgage that was taken out on this home.
Original Mortgage
$254,700
Interest Rate
6.94%
Create a Home Valuation Report for This Property
The Home Valuation Report is an in-depth analysis detailing your home's value as well as a comparison with similar homes in the area
Home Values in the Area
Average Home Value in this Area
Purchase History
| Date | Buyer | Sale Price | Title Company |
|---|---|---|---|
| Tang Steven Tung | $355,000 | Lawyers Title | |
| Hsbc Bank Usa National Association | $355,000 | None Available | |
| Lopez Dario | $610,000 | Orange Coast Title Company | |
| Nguyen Linda Minh | $283,000 | Commerce Title |
Source: Public Records
Mortgage History
| Date | Status | Borrower | Loan Amount |
|---|---|---|---|
| Previous Owner | Lopez Dario | $488,000 | |
| Previous Owner | Nguyen Linda Minh | $254,700 |
Source: Public Records
Tax History Compared to Growth
Tax History
| Year | Tax Paid | Tax Assessment Tax Assessment Total Assessment is a certain percentage of the fair market value that is determined by local assessors to be the total taxable value of land and additions on the property. | Land | Improvement |
|---|---|---|---|---|
| 2025 | $5,380 | $457,146 | $367,484 | $89,662 |
| 2024 | $5,380 | $448,183 | $360,279 | $87,904 |
| 2023 | $5,281 | $439,396 | $353,215 | $86,181 |
| 2022 | $5,163 | $430,781 | $346,289 | $84,492 |
| 2021 | $5,093 | $422,335 | $339,499 | $82,836 |
| 2020 | $5,031 | $418,005 | $336,018 | $81,987 |
| 2019 | $4,965 | $409,809 | $329,429 | $80,380 |
| 2018 | $4,842 | $401,774 | $322,970 | $78,804 |
| 2017 | $4,794 | $393,897 | $316,638 | $77,259 |
| 2016 | $4,583 | $386,174 | $310,429 | $75,745 |
| 2015 | $4,524 | $380,374 | $305,766 | $74,608 |
| 2014 | $4,417 | $372,923 | $299,776 | $73,147 |
Source: Public Records
Map
Nearby Homes
- 4201 W 5th St Unit 314
- 4248 W 5th St
- 3932 W 5th St Unit 202
- 3929 W 5th St Unit 16
- 1114 N Gates St
- 4518 W 1st St
- 4832 W 5th St Unit B
- 526 W Tribella Ct
- 323 N Euclid St Unit 99
- 3625 W 11th St
- 702 N Gunther St
- 14376 Euclid St Unit 1-4
- 432 S Harbor Blvd Unit 101
- 432 S Harbor Blvd Unit 64
- 432 S Harbor Blvd Unit 7
- 5114 W 1st St Unit C
- 5112 W 1st St Unit C
- 13322 Euclid St
- 408 N Jackson St
- 1609 N Parsons Place
- 4322 Roosevelt Ave
- 4314 Roosevelt Ave
- 4317 Silver Dr
- 4326 Roosevelt Ave
- 4313 Silver Dr
- 4321 Silver Dr
- 4310 Roosevelt Ave
- 4325 Silver Dr
- 4309 Silver Dr
- 4317 Roosevelt Ave
- 4313 Roosevelt Ave
- 4330 Roosevelt Ave
- 4325 Roosevelt Ave
- 4309 Roosevelt Ave
- 4329 Silver Dr
- 4402 Roosevelt Ave
- 4329 Roosevelt Ave
- 701 N Mountain View St
- 4305 Roosevelt Ave
- 4401 Silver Dr