432 N Oakhurst Dr Unit 104 Beverly Hills, CA 90210
Estimated payment $16,173/month
Highlights
- Concierge
- Fitness Center
- Two Primary Bedrooms
- Hawthorne Elementary School Rated A
- Automatic Gate
- Gated Community
About This Home
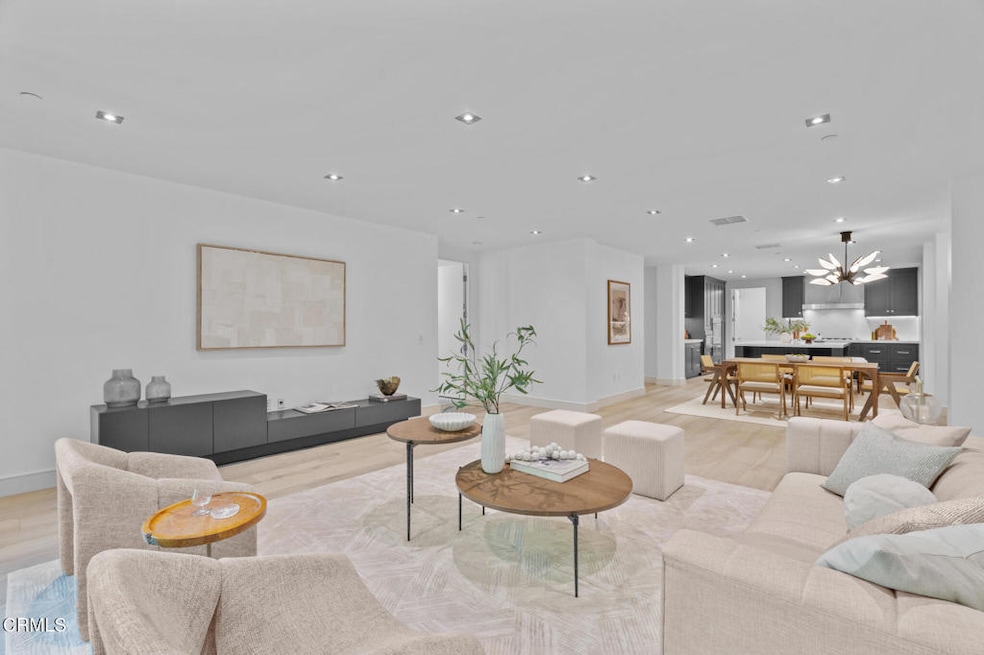
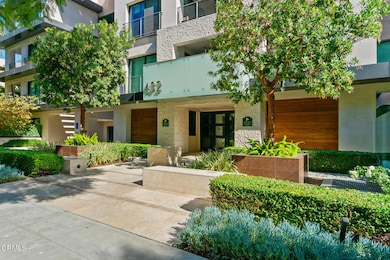
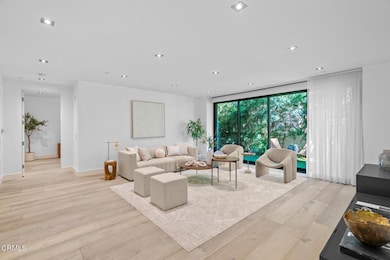
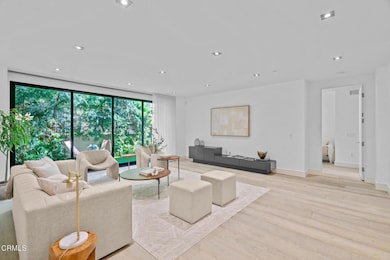
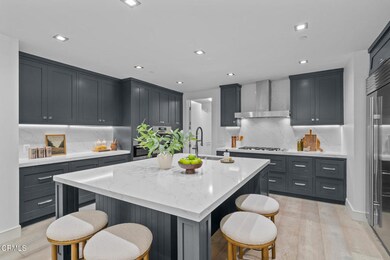
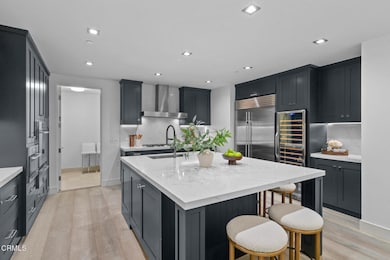
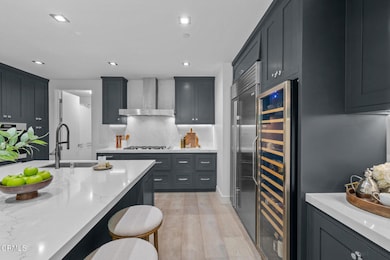
Exemplifying exquisite sophistication and a lifestyle of unparalleled elegance, this residence was completely remodeled by a reputable designer in 2021, and is located at one of the most sought-after and safest buildings in the esteemed enclave of Beverly Hills. The inviting open-concept living room with wide plank hardwood floors and built-in media console effortlessly flows into a tranquil and landscaped outdoor space through a floor to ceiling, wall to wall patio door. Impeccably redesigned, the gourmet chef's kitchen boasts a classy and contemporary aesthetic with dark blue custom kitchen cabinets and an expansive island. Coupled with stainless steel Miele appliances, Subzero refrigerator/freezer, top-of-the-line tall wine fridge, it merges style with everyday functionality. This abode is the perfect place for restful evenings or the most refined gatherings with loved ones. The serene primary bedroom is spacious with access to the outdoor patio via a floor to ceiling patio door, en-suite bathroom and a large walk-in closet. Experience tranquility in this spa-like bathroom, featuring a double-sink vanity, an extra large jacuzzi bathtub w/ jet massage modes for unparalleled relaxation, a spacious walk-in shower and an enclosed water closet. The 2nd bedroom is equipped w/ en-suite bathroom.The pristine guest bathroom is adorned with designer gold-inlaid wall tiles and chic vanity. In-unit laundry room/pantry includes plenty of storage, a newer AI-powered washer/dryer, extra dryer, high-end whole house HALO water treatment system. Other upgrades include HVAC system, ducts, automatic custom window treatment, hardwood floor, built-in floor to ceiling custom shoe cabinet, artificial turf on outdoor patio, fully retractable patio door screens for both living room and primary bedroom, EV charger at parking spot. Embrace the convenience of 3 assigned side-by-side parking in a secure garage with a full privacy gate, plentiful guest parking right across from the unit's parking spaces, and oversized private storage. A remarkable security system offers peace of mind. Enjoy the building's distinguished amenities: 24/7 doorman, video capture entry, concierge services, full fitness center, indoor and outdoor lounges and conference room. Nestled just moments from West Hollywood, Bristol Farms, Rodeo Drive, Whole Foods, amongst other premier shopping, bars and gourmet dining options. This chic residence captures the quintessential Beverly Hills lifestyle.
Property Details
Home Type
- Condominium
Est. Annual Taxes
- $26,581
Year Built
- Built in 2013
Lot Details
- No Units Located Below
- 1 Common Wall
- Sprinkler System
HOA Fees
- $1,900 Monthly HOA Fees
Parking
- 3 Car Attached Garage
- Parking Storage or Cabinetry
- Parking Available
- Side by Side Parking
- Automatic Gate
- Guest Parking
- Parking Lot
- Assigned Parking
- Controlled Entrance
Home Design
- Entry on the 1st floor
Interior Spaces
- 2,110 Sq Ft Home
- Open Floorplan
- Built-In Features
- High Ceiling
- Formal Entry
- Living Room
- L-Shaped Dining Room
- Storage
- Wood Flooring
- Home Security System
Kitchen
- Updated Kitchen
- Eat-In Kitchen
- Walk-In Pantry
- Gas Oven
- Gas Range
- Range Hood
- Microwave
- Freezer
- Dishwasher
- Kitchen Island
- Self-Closing Drawers and Cabinet Doors
Bedrooms and Bathrooms
- 2 Main Level Bedrooms
- Double Master Bedroom
- Walk-In Closet
- Remodeled Bathroom
- Dual Vanity Sinks in Primary Bathroom
- Bathtub
- Walk-in Shower
- Exhaust Fan In Bathroom
- Closet In Bathroom
Laundry
- Laundry Room
- Dryer
- Washer
Accessible Home Design
- Accessible Parking
Outdoor Features
- Enclosed Patio or Porch
- Exterior Lighting
Utilities
- Central Heating and Cooling System
- Water Softener
Listing and Financial Details
- Earthquake Insurance Required
- Tax Lot 1
- Assessor Parcel Number 4342037005
Community Details
Overview
- 34 Units
- 432 North Oakhurst Community Association, Phone Number (844) 905-2637
- Maintained Community
- 5-Story Property
Amenities
- Concierge
- Meeting Room
- Recreation Room
- Community Storage Space
Recreation
- Fitness Center
Pet Policy
- Pets Allowed with Restrictions
Security
- Security Guard
- Resident Manager or Management On Site
- Card or Code Access
- Gated Community
- Carbon Monoxide Detectors
- Fire and Smoke Detector
Map
Home Values in the Area
Average Home Value in this Area
Tax History
| Year | Tax Paid | Tax Assessment Tax Assessment Total Assessment is a certain percentage of the fair market value that is determined by local assessors to be the total taxable value of land and additions on the property. | Land | Improvement |
|---|---|---|---|---|
| 2025 | $26,581 | $2,191,924 | $541,216 | $1,650,708 |
| 2024 | $26,055 | $2,148,946 | $530,604 | $1,618,342 |
| 2023 | $25,588 | $2,106,810 | $520,200 | $1,586,610 |
| 2022 | $24,858 | $2,065,500 | $510,000 | $1,555,500 |
| 2021 | $20,475 | $1,721,572 | $985,279 | $736,293 |
| 2020 | $20,406 | $1,703,921 | $975,177 | $728,744 |
| 2019 | $19,885 | $1,670,511 | $956,056 | $714,455 |
| 2018 | $19,147 | $1,637,757 | $937,310 | $700,447 |
| 2017 | $18,778 | $1,605,645 | $918,932 | $686,713 |
| 2016 | $18,458 | $1,574,163 | $900,914 | $673,249 |
| 2015 | $17,680 | $1,550,519 | $887,382 | $663,137 |
| 2014 | $16,984 | $1,520,148 | $870,000 | $650,148 |
Property History
| Date | Event | Price | List to Sale | Price per Sq Ft |
|---|---|---|---|---|
| 11/25/2025 11/25/25 | Pending | -- | -- | -- |
| 11/11/2025 11/11/25 | For Sale | $2,299,000 | -- | $1,090 / Sq Ft |
Purchase History
| Date | Type | Sale Price | Title Company |
|---|---|---|---|
| Grant Deed | $1,520,500 | Fidelity National Title Co |
Mortgage History
| Date | Status | Loan Amount | Loan Type |
|---|---|---|---|
| Previous Owner | $1,050,000 | Adjustable Rate Mortgage/ARM |
Source: Pasadena-Foothills Association of REALTORS®
MLS Number: P1-24897
APN: 4342-037-005
Disclaimer: Certain information contained herein is derived from information provided by parties other than Homes.com. All information provided is deemed reliable, but is not guaranteed to be accurate and should be independently verified.
![]() IDX information is provided exclusively for personal, non-commercial use, and may not be used for any purpose other than to identify prospective properties consumers may be interested in purchasing. Information is deemed reliable but not guaranteed.
IDX information is provided exclusively for personal, non-commercial use, and may not be used for any purpose other than to identify prospective properties consumers may be interested in purchasing. Information is deemed reliable but not guaranteed.
- 432 N Oakhurst Dr Unit 503
- 419 N Oakhurst Dr Unit 102
- 460 N Palm Dr Unit 501
- 450 N Palm Dr Unit 507
- 447 N Doheny Dr Unit 102
- 425 N Palm Dr Unit 201
- 425 N Palm Dr Unit 403
- 425 N Palm Dr Unit 401
- 425 N Palm Dr Unit 202
- 425 N Palm Dr Unit 104
- 411 N Oakhurst Dr Unit 102
- 450 N Oakhurst Dr Unit 101
- 406 N Oakhurst Dr Unit 204
- 137 N Doheny Dr
- 455 N Oakhurst Dr Unit 3
- 455 N Palm Dr Unit PH
- 457 N Doheny Dr Unit 304
- 458 N Oakhurst Dr Unit 102
- 425 N Maple Dr Unit 602
- 9014 Rangely Ave
