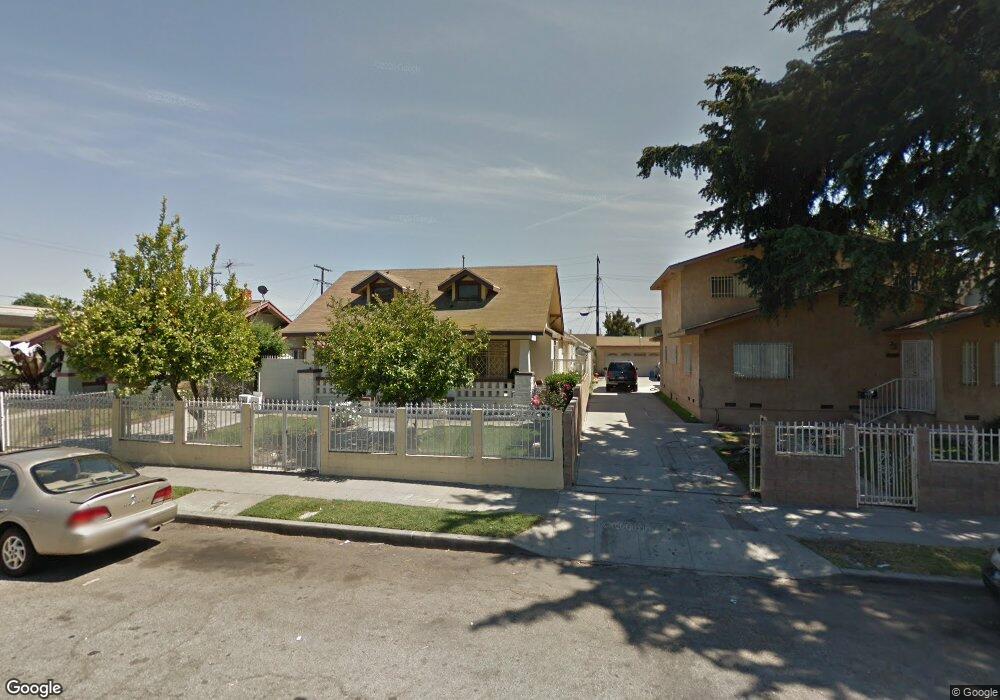
432 W 50th St Los Angeles, CA 90037
Vermont Square NeighborhoodEstimated Value: $676,000 - $806,000
3
Beds
2
Baths
1,918
Sq Ft
$387/Sq Ft
Est. Value
About This Home
This home is located at 432 W 50th St, Los Angeles, CA 90037 and is currently estimated at $743,052, approximately $387 per square foot. 432 W 50th St is a home located in Los Angeles County with nearby schools including Marguerite Poindexter Lamotte Elementary, Dr. James Edward Jones Primary Center, and Los Angeles Academy Middle School.
Ownership History
Date
Name
Owned For
Owner Type
Purchase Details
Closed on
Aug 13, 2013
Sold by
Cyprus Brett M
Bought by
Bmc Cub Llc
Current Estimated Value
Purchase Details
Closed on
Apr 7, 2011
Sold by
Cyprus Jane Dellen
Bought by
Cyprus Brett M
Home Financials for this Owner
Home Financials are based on the most recent Mortgage that was taken out on this home.
Original Mortgage
$119,000
Interest Rate
4.83%
Mortgage Type
New Conventional
Purchase Details
Closed on
Nov 9, 2009
Sold by
Venegas Daniel and Venegas Rosa Elena
Bought by
Cyprus Brett M
Purchase Details
Closed on
Jun 29, 2005
Sold by
Rials Rose M
Bought by
Rials Rose M
Purchase Details
Closed on
Sep 13, 1995
Sold by
Reyes Jose Antonio and Reyes Morelia
Bought by
Venegas Daniel and Venegas Rosa Elena
Home Financials for this Owner
Home Financials are based on the most recent Mortgage that was taken out on this home.
Original Mortgage
$146,292
Interest Rate
7.58%
Mortgage Type
FHA
Create a Home Valuation Report for This Property
The Home Valuation Report is an in-depth analysis detailing your home's value as well as a comparison with similar homes in the area
Home Values in the Area
Average Home Value in this Area
Purchase History
| Date | Buyer | Sale Price | Title Company |
|---|---|---|---|
| Bmc Cub Llc | -- | None Available | |
| Cyprus Brett M | -- | Chicago Title | |
| Cyprus Brett M | -- | None Available | |
| Rials Rose M | -- | -- | |
| Venegas Daniel | $149,000 | Fidelity National Title Ins |
Source: Public Records
Mortgage History
| Date | Status | Borrower | Loan Amount |
|---|---|---|---|
| Previous Owner | Cyprus Brett M | $119,000 | |
| Previous Owner | Venegas Daniel | $146,292 |
Source: Public Records
Tax History Compared to Growth
Tax History
| Year | Tax Paid | Tax Assessment Tax Assessment Total Assessment is a certain percentage of the fair market value that is determined by local assessors to be the total taxable value of land and additions on the property. | Land | Improvement |
|---|---|---|---|---|
| 2025 | $5,386 | $422,910 | $253,747 | $169,163 |
| 2024 | $5,386 | $414,619 | $248,772 | $165,847 |
| 2023 | $5,291 | $406,491 | $243,895 | $162,596 |
| 2022 | $5,059 | $398,521 | $239,113 | $159,408 |
| 2021 | $4,989 | $390,708 | $234,425 | $156,283 |
| 2019 | $4,847 | $379,362 | $227,473 | $151,889 |
| 2018 | $4,710 | $371,929 | $223,013 | $148,916 |
| 2016 | $4,493 | $357,257 | $214,354 | $142,903 |
| 2015 | $4,430 | $351,892 | $211,135 | $140,757 |
| 2014 | $4,459 | $345,000 | $207,000 | $138,000 |
Source: Public Records
Map
Nearby Homes
- 426 W 50th St
- 436 W 50th St
- 5005 S Flower St
- 442 W 50th St
- 452 W 50th St
- 433 W 51st St
- 437 W 51st St
- 427 W 51st St
- 435 W 51st St
- 435 W 51st St
- 5022 S Figueroa St
- 5026 S Figueroa St
- 5018 S Figueroa St
- 443 W 51st St
- 5030 S Figueroa St
- 5014 S Figueroa St
- 5034 S Figueroa St
- 5010 S Figueroa St
- 423 W 51st St
- 5008 S Figueroa St