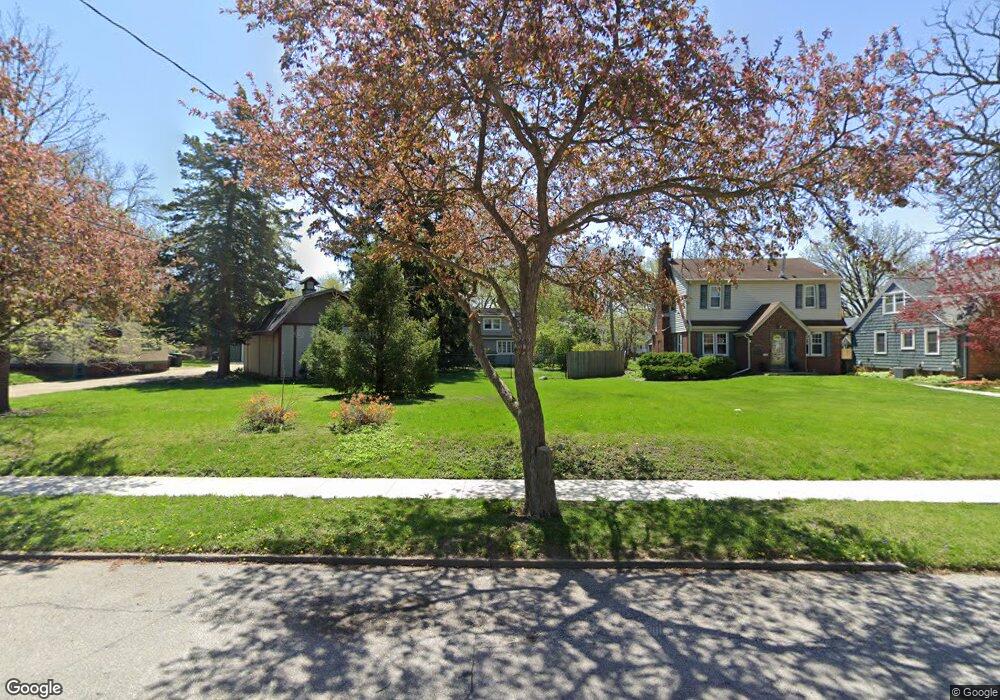
4320 Sheridan Ave Des Moines, IA 50310
Beaverdale NeighborhoodEstimated Value: $230,000 - $260,000
2
Beds
1
Bath
1,606
Sq Ft
$150/Sq Ft
Est. Value
About This Home
This home is located at 4320 Sheridan Ave, Des Moines, IA 50310 and is currently estimated at $240,333, approximately $149 per square foot. 4320 Sheridan Ave is a home located in Polk County with nearby schools including Hillis Elementary School, Meredith Middle School, and Hoover High School.
Ownership History
Date
Name
Owned For
Owner Type
Purchase Details
Closed on
Nov 20, 2024
Sold by
Murray Group Llc
Bought by
Faenza Anthony and Faenza Tracey Lynn
Current Estimated Value
Home Financials for this Owner
Home Financials are based on the most recent Mortgage that was taken out on this home.
Original Mortgage
$213,750
Outstanding Balance
$211,747
Interest Rate
6.44%
Mortgage Type
New Conventional
Estimated Equity
$28,586
Purchase Details
Closed on
Jun 7, 2001
Sold by
Thompson Michael A
Bought by
Teas Kathleen K
Purchase Details
Closed on
Jul 24, 2000
Sold by
Olson Lou and Olson Dwight
Bought by
Teas Kathleen K and Thompson Michael A
Home Financials for this Owner
Home Financials are based on the most recent Mortgage that was taken out on this home.
Original Mortgage
$91,950
Interest Rate
8.27%
Purchase Details
Closed on
Jul 21, 1997
Sold by
Janssen Dean Leonard
Bought by
Janssen Lou Quinn and Quinn Lou
Create a Home Valuation Report for This Property
The Home Valuation Report is an in-depth analysis detailing your home's value as well as a comparison with similar homes in the area
Home Values in the Area
Average Home Value in this Area
Purchase History
| Date | Buyer | Sale Price | Title Company |
|---|---|---|---|
| Faenza Anthony | $225,000 | None Listed On Document | |
| Faenza Anthony | $225,000 | None Listed On Document | |
| Teas Kathleen K | -- | -- | |
| Teas Kathleen K | $96,500 | -- | |
| Janssen Lou Quinn | -- | -- |
Source: Public Records
Mortgage History
| Date | Status | Borrower | Loan Amount |
|---|---|---|---|
| Open | Faenza Anthony | $213,750 | |
| Closed | Faenza Anthony | $213,750 | |
| Previous Owner | Teas Kathleen K | $91,950 |
Source: Public Records
Tax History Compared to Growth
Tax History
| Year | Tax Paid | Tax Assessment Tax Assessment Total Assessment is a certain percentage of the fair market value that is determined by local assessors to be the total taxable value of land and additions on the property. | Land | Improvement |
|---|---|---|---|---|
| 2025 | $3,636 | $226,700 | $69,300 | $157,400 |
| 2024 | $3,636 | $202,300 | $62,300 | $140,000 |
| 2023 | $3,692 | $202,300 | $62,300 | $140,000 |
| 2022 | $3,662 | $165,500 | $55,100 | $110,400 |
| 2021 | $3,552 | $165,500 | $55,100 | $110,400 |
| 2020 | $3,684 | $150,900 | $50,400 | $100,500 |
| 2019 | $3,722 | $150,900 | $50,400 | $100,500 |
| 2018 | $3,324 | $147,000 | $44,800 | $102,200 |
| 2017 | $2,920 | $147,000 | $44,800 | $102,200 |
| 2016 | $2,840 | $129,800 | $39,300 | $90,500 |
| 2015 | $2,840 | $129,800 | $39,300 | $90,500 |
| 2014 | $2,688 | $123,200 | $37,000 | $86,200 |
Source: Public Records
Map
Nearby Homes
- 4314 Sheridan Ave
- 4326 Sheridan Ave
- 4310 Sheridan Ave
- 4340 Sheridan Ave
- 4323 Beaver Crest Dr
- 4333 Beaver Crest Dr
- 4317 Beaver Crest Dr
- 4306 Sheridan Ave
- 4334 Sheridan Ave
- 4315 Beaver Crest Dr
- 4323 Sheridan Ave
- 4319 Sheridan Ave
- 4315 Sheridan Ave
- 4309 Beaver Crest Dr
- 4300 Sheridan Ave
- 4300 Sheridan Ave
- 4331 Sheridan Ave
- 4311 Sheridan Ave
- 4307 Beaver Crest Dr
- 4333 Sheridan Ave