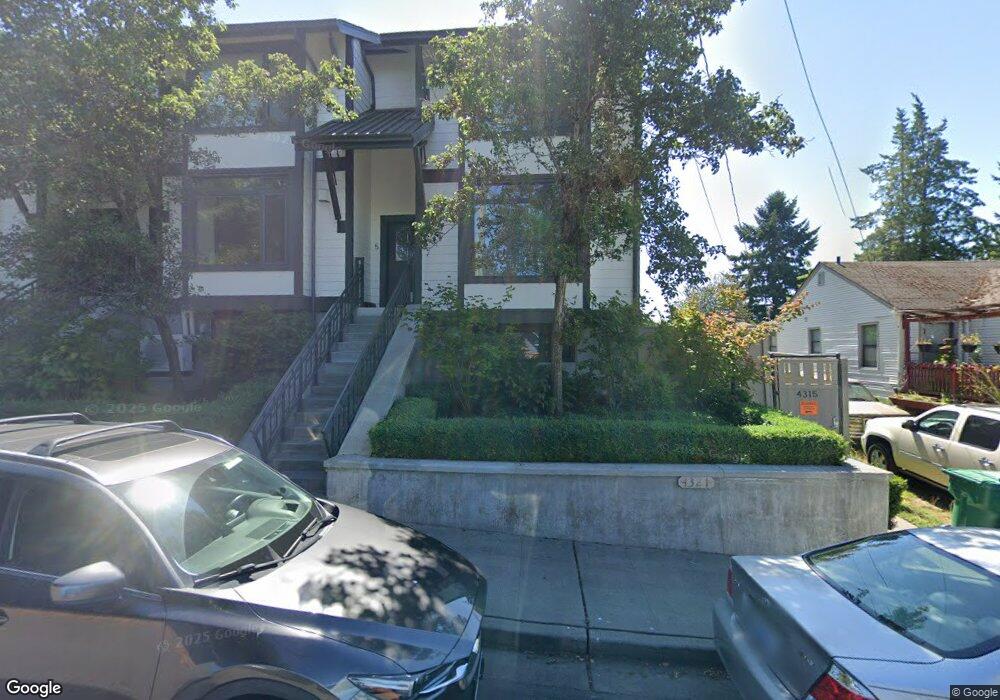
4321 SW Hudson St Unit B4 Seattle, WA 98116
Seaview NeighborhoodEstimated Value: $732,000 - $833,162
3
Beds
4
Baths
1,704
Sq Ft
$457/Sq Ft
Est. Value
About This Home
This home is located at 4321 SW Hudson St Unit B4, Seattle, WA 98116 and is currently estimated at $778,791, approximately $457 per square foot. 4321 SW Hudson St Unit B4 is a home located in King County with nearby schools including Fairmount Park Elementary, Madison Middle School, and West Seattle High School.
Ownership History
Date
Name
Owned For
Owner Type
Purchase Details
Closed on
Apr 20, 2021
Sold by
Gilmour Andrew J and Gilmour Jessica A
Bought by
Gilmour Andrew J and Gilmour Jessica A
Current Estimated Value
Home Financials for this Owner
Home Financials are based on the most recent Mortgage that was taken out on this home.
Original Mortgage
$157,600
Outstanding Balance
$141,832
Interest Rate
2.8%
Mortgage Type
New Conventional
Estimated Equity
$636,959
Purchase Details
Closed on
Sep 20, 2010
Sold by
Deutsche Bank National Trust Company
Bought by
Gilmour Andrew J and Rosenberg Jessica A
Home Financials for this Owner
Home Financials are based on the most recent Mortgage that was taken out on this home.
Original Mortgage
$200,900
Interest Rate
4.16%
Purchase Details
Closed on
Jul 15, 2009
Sold by
Myers Carol A
Bought by
Deutsche Bank National Trust Company
Purchase Details
Closed on
Jun 2, 2004
Sold by
West Seattle Property Llc
Bought by
Myers Carol A
Home Financials for this Owner
Home Financials are based on the most recent Mortgage that was taken out on this home.
Original Mortgage
$283,950
Interest Rate
5.5%
Create a Home Valuation Report for This Property
The Home Valuation Report is an in-depth analysis detailing your home's value as well as a comparison with similar homes in the area
Home Values in the Area
Average Home Value in this Area
Purchase History
| Date | Buyer | Sale Price | Title Company |
|---|---|---|---|
| Gilmour Andrew J | -- | Accommodation | |
| Gilmour Andrew J | $239,800 | First American | |
| Deutsche Bank National Trust Company | $285,000 | None Available | |
| Myers Carol A | $354,950 | Chicago Title |
Source: Public Records
Mortgage History
| Date | Status | Borrower | Loan Amount |
|---|---|---|---|
| Open | Gilmour Andrew J | $157,600 | |
| Previous Owner | Gilmour Andrew J | $200,900 | |
| Previous Owner | Myers Carol A | $283,950 | |
| Closed | Myers Carol A | $53,242 |
Source: Public Records
Tax History Compared to Growth
Tax History
| Year | Tax Paid | Tax Assessment Tax Assessment Total Assessment is a certain percentage of the fair market value that is determined by local assessors to be the total taxable value of land and additions on the property. | Land | Improvement |
|---|---|---|---|---|
| 2024 | $6,721 | $693,000 | $271,100 | $421,900 |
| 2023 | $5,795 | $708,000 | $271,100 | $436,900 |
| 2022 | $5,905 | $676,000 | $280,400 | $395,600 |
| 2021 | $6,556 | $636,000 | $261,700 | $374,300 |
| 2020 | $6,206 | $675,000 | $261,700 | $413,300 |
| 2018 | $5,650 | $642,000 | $224,300 | $417,700 |
| 2017 | $4,732 | $568,000 | $186,900 | $381,100 |
| 2016 | $3,998 | $490,000 | $149,500 | $340,500 |
| 2015 | $4,182 | $402,000 | $130,800 | $271,200 |
| 2014 | -- | $433,000 | $130,800 | $302,200 |
| 2013 | -- | $319,000 | $130,800 | $188,200 |
Source: Public Records
Map
Nearby Homes
- 5001 California Ave SW Unit 212
- 5001 California Ave SW Unit 402
- 5000 California Ave SW Unit 406
- 5000 California Ave SW Unit 304
- 5038 California Ave SW Unit 2
- 4853 42nd Ave SW
- 4823 42nd Ave SW Unit B
- 4823 42nd Ave SW
- 4817 42nd Ave SW
- 5250 46th Ave SW
- 5033 40th Ave SW
- 4823 40th Ave SW Unit B&C
- 4852 40th Ave SW Unit B
- 4831 Fauntleroy Way SW Unit 401
- 5420 California Ave SW
- 5430 California Ave SW Unit 3B
- 5430 California Ave SW Unit 2C
- 5008 Fauntleroy Way SW Unit B
- 5439 California Ave SW Unit H
- 5229 Fauntleroy Way SW
- 4321 SW Hudson St Unit 4
- 4321 SW Hudson St Unit 5
- 4321 SW Hudson St Unit 6
- 4321 SW Hudson St
- 4321 SW Hudson St Unit 2
- 4321 SW Hudson St Unit B5
- 4321 SW Hudson St Unit B1
- 4321 SW Hudson St Unit B3
- 4321 SW Hudson St Unit B2
- 4321 SW Hudson St Unit 2C9
- 4321 SW Hudson St Unit 2C8
- 4321 SW Hudson St Unit 2C7
- 4321 SW Hudson St Unit 2C6
- 4321 SW Hudson St Unit 1
- 4327 SW Hudson St
- 4315 SW Hudson St Unit 9
- 4315 SW Hudson St Unit C9
- 4333 SW Hudson St
- 4326 SW Dawson St
- 5001 California Ave SW Unit 111