4322 W 106th St Inglewood, CA 90304
Lennox NeighborhoodEstimated payment $16,636/month
About This Home
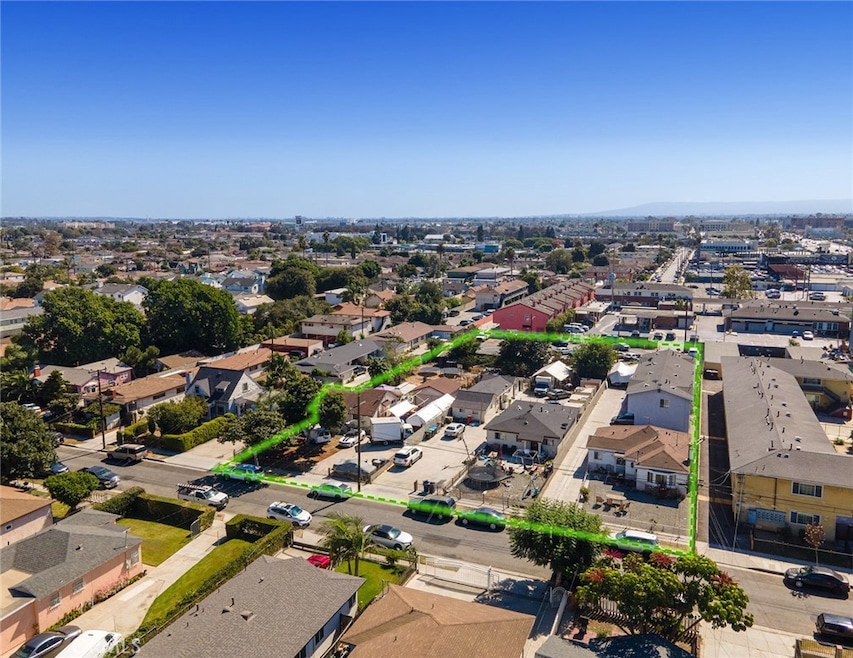
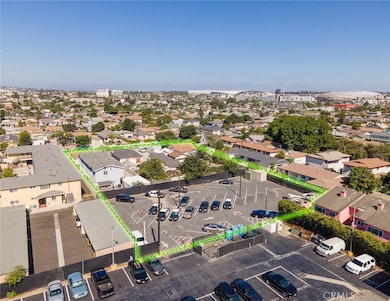
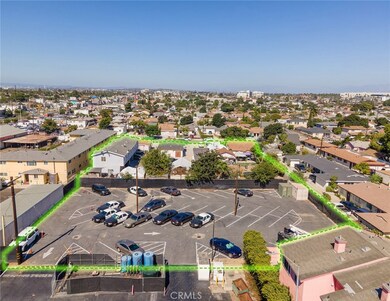
The Parham Group at Marcus & Millichap is pleased to present an eight unit multifamily assemblage on over 52,000 SF of land in unincorporated Inglewood with a large portion leased to County of Los Angeles Sheriff’s Department, providing both stability and institutional credit strength. The property presents a rare opportunity to acquire a fully income producing asset with at a competitive going in return with significant upside in rents. The residential component features a diverse mix of three bedroom and one bedroom units, many recently improved, delivering steady in place income with meaningful rental upside as rents are all below market. The parking area leased to the County adds durable, non residential cash flow backed by a government entity, contributing roughly $6,200 per month in additional income. Positioned within minutes of SoFi Stadium, the Intuit Dome, and Hollywood Park, the asset is poised to benefit from the continued revitalization of Inglewood’s entertainment corridor. Combining stable current returns with long term redevelopment potential, this property offers investors an attractive blend of immediate yield, County-backed income, and irreplaceable land value in one of Los Angeles County’s most dynamic submarkets.
Listing Agent
Parham Khoshbakhtian, Broker Brokerage Email: Parham.khoshbakhtian@marcusmillichap.com License #01446947 Listed on: 12/01/2025
Property Details
Home Type
- Multi-Family
Est. Annual Taxes
- $10,825
Year Built
- Built in 1909
Lot Details
- 1.2 Acre Lot
- No Common Walls
- 4034025016,4034025017
Parking
- 1 Car Garage
Home Design
- Entry on the 1st floor
Interior Spaces
- 6,698 Sq Ft Home
- 2-Story Property
Bedrooms and Bathrooms
- 4 Bedrooms
- 3 Bathrooms
Location
- Urban Location
Listing and Financial Details
- Tax Lot 477
- Tax Tract Number 211
- Assessor Parcel Number 4034025004
- $1,678 per year additional tax assessments
Community Details
Overview
- No Home Owners Association
- 6 Buildings
- 9 Units
Building Details
- 9 Leased Units
- Rent Control
- Electric Expense $9,600
- Insurance Expense $9,000
- Professional Management Expense $9,219
- New Taxes Expense $36,000
- Operating Expense $74,524
- Gross Income $230,472
- Net Operating Income $155,948
Map
Home Values in the Area
Average Home Value in this Area
Tax History
| Year | Tax Paid | Tax Assessment Tax Assessment Total Assessment is a certain percentage of the fair market value that is determined by local assessors to be the total taxable value of land and additions on the property. | Land | Improvement |
|---|---|---|---|---|
| 2025 | $10,825 | $726,926 | $436,156 | $290,770 |
| 2024 | $10,825 | $712,673 | $427,604 | $285,069 |
| 2023 | $4,850 | $247,630 | $200,722 | $46,908 |
| 2022 | $4,803 | $242,776 | $196,787 | $45,989 |
| 2021 | $4,676 | $238,017 | $192,929 | $45,088 |
| 2019 | $4,380 | $230,958 | $187,207 | $43,751 |
| 2018 | $4,064 | $226,431 | $183,537 | $42,894 |
| 2016 | $3,721 | $217,640 | $176,411 | $41,229 |
| 2015 | $3,628 | $214,372 | $173,762 | $40,610 |
| 2014 | $3,617 | $210,174 | $170,359 | $39,815 |
Property History
| Date | Event | Price | List to Sale | Price per Sq Ft |
|---|---|---|---|---|
| 12/01/2025 12/01/25 | For Sale | $3,000,000 | -- | $448 / Sq Ft |
Purchase History
| Date | Type | Sale Price | Title Company |
|---|---|---|---|
| Quit Claim Deed | -- | None Listed On Document | |
| Quit Claim Deed | -- | None Available | |
| Interfamily Deed Transfer | -- | None Available | |
| Interfamily Deed Transfer | -- | -- |
Source: California Regional Multiple Listing Service (CRMLS)
MLS Number: OC25268240
APN: 4034-025-004
Disclaimer: Certain information contained herein is derived from information provided by parties other than Homes.com. All information provided is deemed reliable, but is not guaranteed to be accurate and should be independently verified.
![]() The multiple listing data appearing on this website, or contained in reports produced therefrom, is owned and copyrighted by California Regional Multiple Listing Service, Inc. ("CRMLS") and is protected by all applicable copyright laws. Information provided is for viewer's personal, non-commercial use and may not be used for any purpose other than to identify prospective properties the viewer may be interested in purchasing. All listing data, including but not limited to square footage and lot size is believed to be accurate, but the listing Agent, listing Broker and CRMLS and its affiliates do not warrant or guarantee such accuracy. The viewer should independently verify the listed data prior to making any decisions based on such information by personal inspection and/or contacting a real estate professional.
The multiple listing data appearing on this website, or contained in reports produced therefrom, is owned and copyrighted by California Regional Multiple Listing Service, Inc. ("CRMLS") and is protected by all applicable copyright laws. Information provided is for viewer's personal, non-commercial use and may not be used for any purpose other than to identify prospective properties the viewer may be interested in purchasing. All listing data, including but not limited to square footage and lot size is believed to be accurate, but the listing Agent, listing Broker and CRMLS and its affiliates do not warrant or guarantee such accuracy. The viewer should independently verify the listed data prior to making any decisions based on such information by personal inspection and/or contacting a real estate professional.
Based on information from California Regional Multiple Listing Service, Inc. and /or other sources. All data, including all measurements and calculations of area, is obtained from various sources and has not been, and will not be, verified by broker or MLS. All information should be independently reviewed and verified for accuracy. Properties may or may not be listed by the office/agent presenting the information
- 4341 W 106th St
- 4203 W 104th St
- 10311 S Grevillea Ave
- 4077 W 103rd St
- 11031 S Burin Ave
- 10914 S Osage Ave
- 4115 W 111th St
- 4136 W 111th St
- 511 E 99th St
- 11319 Larch Ave
- 3871 W 109th St Unit 1
- 10905 Dalerose Ave
- 3856 W 108th St
- 509 E 97th St
- 415 E 97th St
- 10333 S Inglewood Ave
- 316 E Hardy St
- 3803 W 107th St
- 1049 Larch St Unit 4
- 10701 Doty Ave
- 4108 W 106th St
- 10213 Burin Ave Unit 10213
- 10517 Firmona Ave
- 11006 Mansel Ave
- 11004 Mansel Ave
- 318 E 99th St
- 4115 W Century Blvd Unit 4
- 4616 W 111th St
- 545 E 99th St Unit 6
- 11017 Condon Ave
- 3908 W 109th St
- 3906 W 109th St
- 621 E 99th St
- 643 E 99th St
- 10928 S Inglewood Ave Unit 204
- 3837 W 110th St
- 10802 Doty Ave Unit 10806
- 10202 Doty Ave
- 11503 Menlo Ave
- 1023 Larch St Unit 4
