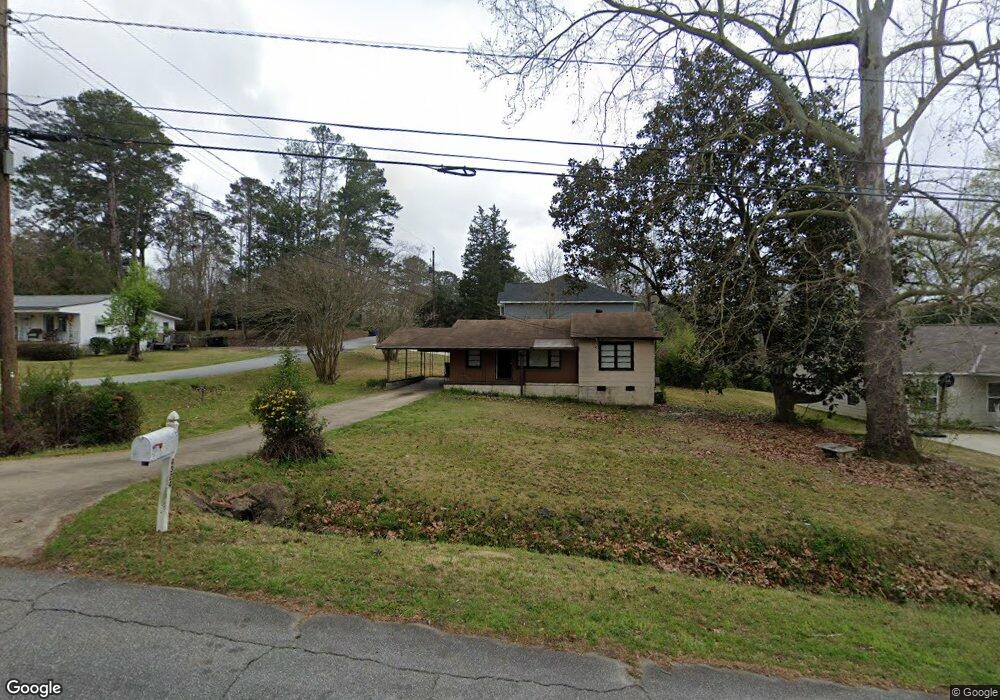
4324 Byron St Columbus, GA 31907
Estimated Value: $70,000 - $128,000
2
Beds
2
Baths
990
Sq Ft
$95/Sq Ft
Est. Value
About This Home
This home is located at 4324 Byron St, Columbus, GA 31907 and is currently estimated at $94,000, approximately $94 per square foot. 4324 Byron St is a home located in Muscogee County with nearby schools including Reese Road Leadership Academy, Fort Middle School, and Hardaway High School.
Ownership History
Date
Name
Owned For
Owner Type
Purchase Details
Closed on
Jul 30, 2024
Sold by
Mlp Properties Llc
Bought by
Tpk Capital Llc
Current Estimated Value
Home Financials for this Owner
Home Financials are based on the most recent Mortgage that was taken out on this home.
Original Mortgage
$57,200
Outstanding Balance
$52,854
Interest Rate
7.47%
Mortgage Type
New Conventional
Estimated Equity
$41,146
Purchase Details
Closed on
Apr 5, 2023
Sold by
F & M Bank And Trust Company
Bought by
Mlp Properties Llc
Purchase Details
Closed on
Oct 17, 2011
Sold by
Starlin Vivian Juanita
Bought by
Patterson Michael N and Patterson Mary L
Create a Home Valuation Report for This Property
The Home Valuation Report is an in-depth analysis detailing your home's value as well as a comparison with similar homes in the area
Home Values in the Area
Average Home Value in this Area
Purchase History
| Date | Buyer | Sale Price | Title Company |
|---|---|---|---|
| Tpk Capital Llc | $71,500 | None Listed On Document | |
| Mlp Properties Llc | -- | None Listed On Document | |
| Patterson Michael N | $20,000 | -- | |
| Patterson Michael N | $52,900 | -- |
Source: Public Records
Mortgage History
| Date | Status | Borrower | Loan Amount |
|---|---|---|---|
| Open | Tpk Capital Llc | $57,200 |
Source: Public Records
Tax History Compared to Growth
Tax History
| Year | Tax Paid | Tax Assessment Tax Assessment Total Assessment is a certain percentage of the fair market value that is determined by local assessors to be the total taxable value of land and additions on the property. | Land | Improvement |
|---|---|---|---|---|
| 2025 | $1,051 | $33,128 | $6,024 | $27,104 |
| 2024 | $1,051 | $26,860 | $6,024 | $20,836 |
| 2023 | $1,058 | $26,860 | $6,024 | $20,836 |
| 2022 | $915 | $22,404 | $6,024 | $16,380 |
| 2021 | $722 | $17,676 | $6,024 | $11,652 |
| 2020 | $722 | $17,676 | $6,024 | $11,652 |
| 2019 | $724 | $17,676 | $6,024 | $11,652 |
| 2018 | $833 | $20,320 | $6,484 | $13,836 |
| 2017 | $835 | $20,320 | $6,484 | $13,836 |
| 2016 | $743 | $18,001 | $4,176 | $13,825 |
| 2015 | $857 | $18,001 | $4,176 | $13,825 |
| 2014 | $1,209 | $29,244 | $4,176 | $25,068 |
| 2013 | -- | $29,244 | $4,176 | $25,068 |
Source: Public Records
Map
Nearby Homes
- 2879 Grant Rd
- 4317 Byron St
- 4355 Byron St
- 2871 Barbara Rd
- 4330 Wilson St
- 2821 Barbara Rd
- 2951 Florence Dr
- 4635 Delfair Dr
- 4439 Florence Dr
- 2661 Fernwood Ave
- 3053 Reese Rd
- 2 Hidden Woods Ct
- 4503 Melborne Dr
- 4268 Yates Dr
- 4248 Yates Dr
- 3409 Ambassador Dr
- 2608 Juniper Ave
- 4332 Fay Dr
- 4237 Fort St
- 2514 Avalon Rd