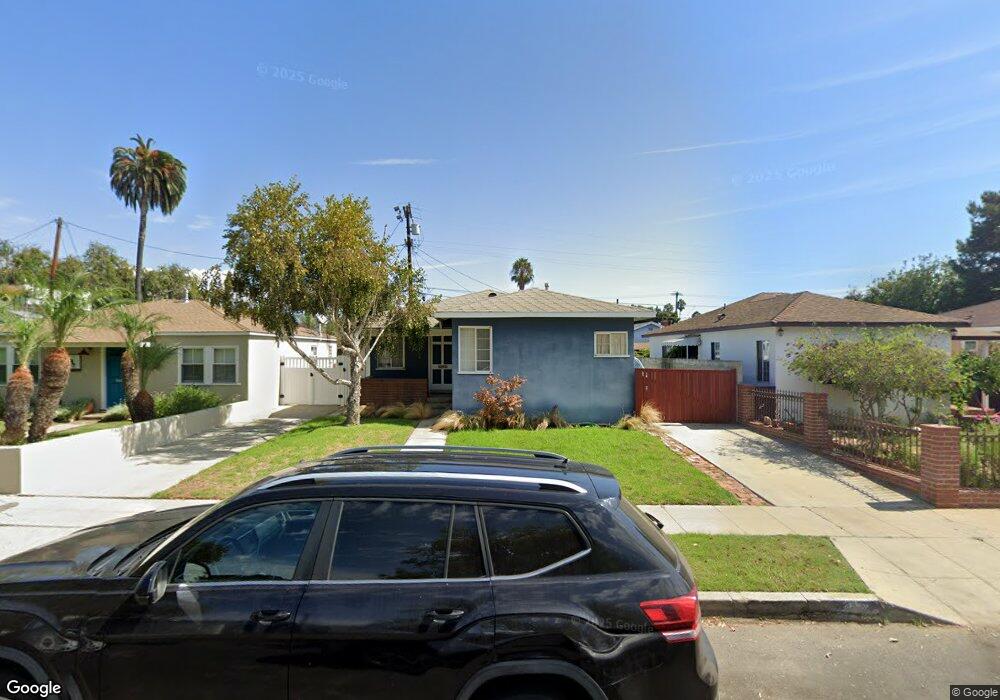
4324 Moore St Los Angeles, CA 90066
Del Rey NeighborhoodEstimated Value: $1,200,094 - $1,496,000
2
Beds
1
Bath
899
Sq Ft
$1,498/Sq Ft
Est. Value
About This Home
This home is located at 4324 Moore St, Los Angeles, CA 90066 and is currently estimated at $1,346,274, approximately $1,497 per square foot. 4324 Moore St is a home located in Los Angeles County with nearby schools including La Ballona Elementary School, Culver City Middle School, and Culver City High School.
Ownership History
Date
Name
Owned For
Owner Type
Purchase Details
Closed on
Jan 15, 2003
Sold by
Hedge Michelle V
Bought by
Heglund Jon
Current Estimated Value
Home Financials for this Owner
Home Financials are based on the most recent Mortgage that was taken out on this home.
Original Mortgage
$312,000
Outstanding Balance
$132,520
Interest Rate
5.96%
Estimated Equity
$1,213,754
Purchase Details
Closed on
Jan 3, 2003
Sold by
Deloach Monique
Bought by
Heglund Jon
Home Financials for this Owner
Home Financials are based on the most recent Mortgage that was taken out on this home.
Original Mortgage
$312,000
Outstanding Balance
$132,520
Interest Rate
5.96%
Estimated Equity
$1,213,754
Create a Home Valuation Report for This Property
The Home Valuation Report is an in-depth analysis detailing your home's value as well as a comparison with similar homes in the area
Home Values in the Area
Average Home Value in this Area
Purchase History
| Date | Buyer | Sale Price | Title Company |
|---|---|---|---|
| Heglund Jon | $390,000 | Southland Title | |
| Heglund Jon | -- | Southland Title |
Source: Public Records
Mortgage History
| Date | Status | Borrower | Loan Amount |
|---|---|---|---|
| Open | Heglund Jon | $312,000 | |
| Closed | Heglund Jon | $39,000 |
Source: Public Records
Tax History Compared to Growth
Tax History
| Year | Tax Paid | Tax Assessment Tax Assessment Total Assessment is a certain percentage of the fair market value that is determined by local assessors to be the total taxable value of land and additions on the property. | Land | Improvement |
|---|---|---|---|---|
| 2025 | $7,739 | $564,832 | $451,873 | $112,959 |
| 2024 | $7,739 | $553,758 | $443,013 | $110,745 |
| 2023 | $7,746 | $542,901 | $434,327 | $108,574 |
| 2022 | $7,045 | $532,257 | $425,811 | $106,446 |
| 2021 | $7,032 | $521,821 | $417,462 | $104,359 |
| 2019 | $6,685 | $506,345 | $405,081 | $101,264 |
| 2018 | $6,453 | $496,418 | $397,139 | $99,279 |
| 2016 | $5,996 | $477,143 | $381,718 | $95,425 |
| 2015 | $5,950 | $469,977 | $375,985 | $93,992 |
| 2014 | $5,989 | $460,771 | $368,620 | $92,151 |
Source: Public Records
Map
Nearby Homes
- 4260 Mcconnell Blvd
- 4250 Mcconnell Blvd
- 4373 Mcconnell Blvd
- 4336 Alla Rd
- 13065 Mindanao Way Unit 3
- 12836 Gilmore Ave
- 12930 Gilmore Ave
- 4220 Kenyon Ave
- 12939 Greene Ave
- 4410 Stewart Ave
- 12534 Gilmore Ave
- 13044 Mindanao Way Unit 2
- 12870 Walsh Ave
- 12520 Gilmore Ave
- 4226 Redwood Ave
- 4025 Beethoven St
- 4342 Redwood Ave Unit C301
- 4342 Redwood Ave Unit C115
- 12837 Bonaparte Ave
- 4128 Kenyon Ave
- 4328 Moore St
- 4318 Moore St
- 4325 Mcconnell Blvd
- 4321 Mcconnell Blvd
- 4329 Mcconnell Blvd
- 4317 Mcconnell Blvd
- 4336 Moore St
- 4312 Moore St
- 4333 Mcconnell Blvd
- 4313 Mcconnell Blvd
- 4340 Moore St
- 4339 Mcconnell Blvd
- 4308 Moore St
- 4343 Mcconnell Blvd
- 4344 Moore St
- 12732 Maxella Ave
- 4328 Mcconnell Blvd
- 4318 Mcconnell Blvd
- 4347 Mcconnell Blvd
- 4348 Moore St