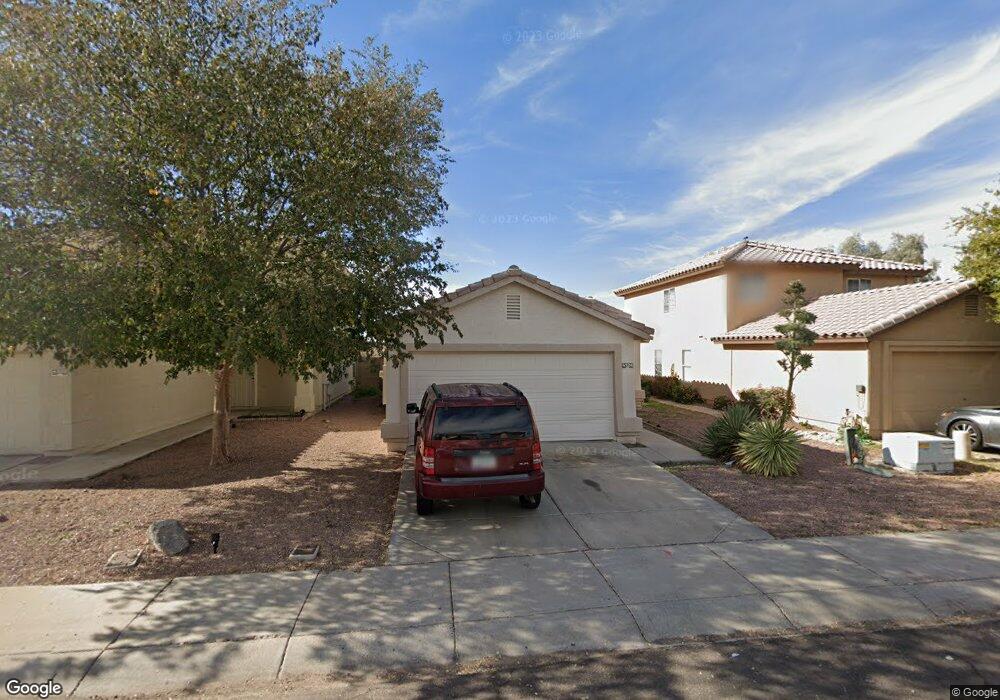
4324 N 113th Dr Unit 2 Phoenix, AZ 85037
Villa de Paz NeighborhoodEstimated Value: $311,547 - $361,000
3
Beds
2
Baths
1,238
Sq Ft
$271/Sq Ft
Est. Value
About This Home
This home is located at 4324 N 113th Dr Unit 2, Phoenix, AZ 85037 and is currently estimated at $335,387, approximately $270 per square foot. 4324 N 113th Dr Unit 2 is a home located in Maricopa County with nearby schools including Copper King Elementary School, Westview High School, and Legacy Traditional School - Phoenix.
Ownership History
Date
Name
Owned For
Owner Type
Purchase Details
Closed on
Jul 12, 2011
Sold by
Mc Groups Llc
Bought by
Zhang Jun and Wang Chiyu
Current Estimated Value
Purchase Details
Closed on
Apr 4, 2011
Sold by
Phh Mortgage Services
Bought by
Mg Groups Llc
Purchase Details
Closed on
Jan 18, 2011
Sold by
Humphrey Craig J and Humphrey Carole J
Bought by
Phh Mortgage Services
Purchase Details
Closed on
Aug 16, 2003
Sold by
Price Chad R and Price Bedie L
Bought by
Humphrey Craig J and Humphrey Carole J
Home Financials for this Owner
Home Financials are based on the most recent Mortgage that was taken out on this home.
Original Mortgage
$110,200
Interest Rate
5.6%
Mortgage Type
New Conventional
Purchase Details
Closed on
Mar 16, 1999
Sold by
Hancock Communities Llc
Bought by
Price Chad R and Price Bedie L
Home Financials for this Owner
Home Financials are based on the most recent Mortgage that was taken out on this home.
Original Mortgage
$84,356
Interest Rate
6.73%
Mortgage Type
FHA
Create a Home Valuation Report for This Property
The Home Valuation Report is an in-depth analysis detailing your home's value as well as a comparison with similar homes in the area
Home Values in the Area
Average Home Value in this Area
Purchase History
| Date | Buyer | Sale Price | Title Company |
|---|---|---|---|
| Zhang Jun | $79,900 | Lawyers Title Of Arizona Inc | |
| Mg Groups Llc | $58,000 | Equity Title Agency Inc | |
| Phh Mortgage Services | $61,425 | First American Title | |
| Humphrey Craig J | $116,000 | Arizona Title Agency Inc | |
| Price Chad R | $88,420 | Lawyers Title Of Arizona Inc | |
| Hancock Communities Llc | -- | Lawyers Title Of Arizona Inc |
Source: Public Records
Mortgage History
| Date | Status | Borrower | Loan Amount |
|---|---|---|---|
| Previous Owner | Humphrey Craig J | $110,200 | |
| Previous Owner | Price Chad R | $84,356 |
Source: Public Records
Tax History
| Year | Tax Paid | Tax Assessment Tax Assessment Total Assessment is a certain percentage of the fair market value that is determined by local assessors to be the total taxable value of land and additions on the property. | Land | Improvement |
|---|---|---|---|---|
| 2025 | $1,418 | $8,767 | -- | -- |
| 2024 | $1,291 | $8,350 | -- | -- |
| 2023 | $1,291 | $22,100 | $4,420 | $17,680 |
| 2022 | $1,243 | $17,400 | $3,480 | $13,920 |
| 2021 | $1,190 | $16,520 | $3,300 | $13,220 |
| 2020 | $1,157 | $15,660 | $3,130 | $12,530 |
| 2019 | $1,147 | $12,430 | $2,480 | $9,950 |
| 2018 | $1,083 | $11,570 | $2,310 | $9,260 |
| 2017 | $1,015 | $10,450 | $2,090 | $8,360 |
| 2016 | $936 | $9,770 | $1,950 | $7,820 |
| 2015 | $904 | $8,930 | $1,780 | $7,150 |
Source: Public Records
Map
Nearby Homes
- 11218 W Glenrosa Ave Unit 2
- 11239 W Campbell Ave Unit 2
- 4423 N 112th Ave
- 11120 W Amelia Ave
- 4629 N 111th Ln
- 4549 N 111th Dr
- 11330 W Rosewood Dr
- 11316 W Primrose Dr
- 3817 N Carnation Ln
- 11028 W Crimson Ln
- 10736 W Turney Ave
- 11009 W Mariposa Dr
- 10707 W Turney Ave
- 10705 W Montecito Ave
- 12360 W Indian School Rd
- 10743 W Coolidge St
- 10821 W Elm St Unit 4
- 4217 N 106th Dr
- 10817 W Pierson St
- 10611 W Avenida Cordoniz
- 4324 N 113th Dr Unit 106
- 4324 N 113th Dr Unit 105
- 4324 N 113th Dr Unit 101
- 4320 N 113th Dr
- 4326 N 113th Dr Unit 2
- 4316 N 113th Dr
- 4330 N 113th Dr
- 4314 N 113th Dr
- 4332 N 113th Dr
- 4321 N 113th Dr
- 4325 N 113th Dr
- 4310 N 113th Dr
- 4336 N 113th Dr
- 4317 N 113th Dr
- 4327 N 113th Dr Unit 2
- 4315 N 113th Dr
- 11309 W Turney Ave
- 4308 N 113th Dr
- 4340 N 113th Dr
- 4311 N 113th Dr
Your Personal Tour Guide
Ask me questions while you tour the home.