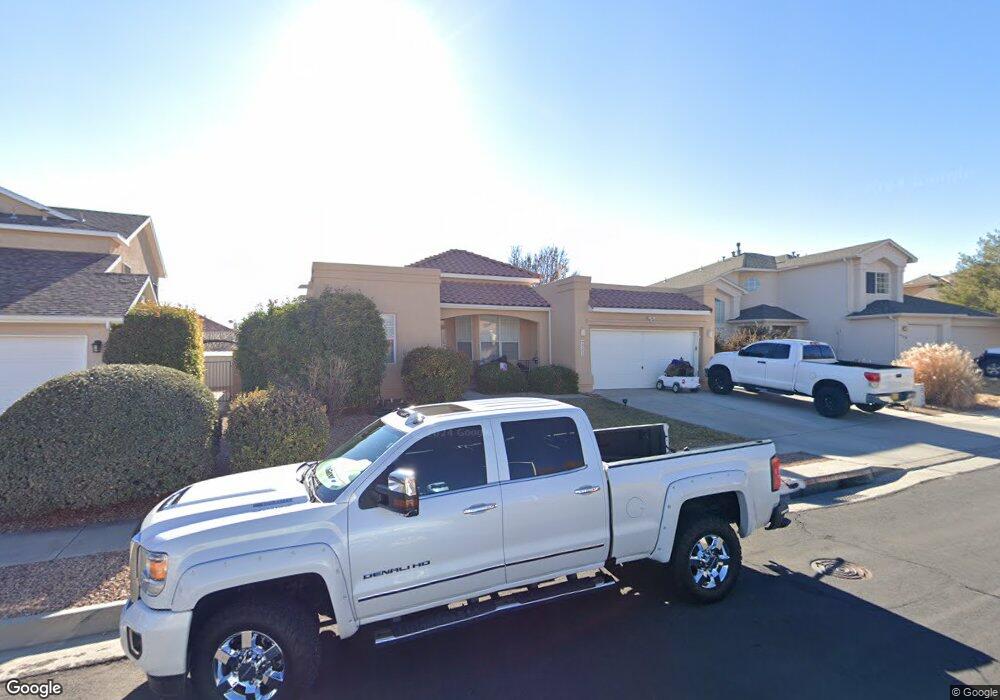
4324 Rancho Centro NW Unit NW Albuquerque, NM 87120
Taylor Ranch NeighborhoodEstimated Value: $386,000 - $438,000
3
Beds
2
Baths
1,950
Sq Ft
$211/Sq Ft
Est. Value
About This Home
This home is located at 4324 Rancho Centro NW Unit NW, Albuquerque, NM 87120 and is currently estimated at $410,797, approximately $210 per square foot. 4324 Rancho Centro NW Unit NW is a home located in Bernalillo County with nearby schools including Petroglyph Elementary School, L.B. Johnson Middle School, and Volcano Vista High School.
Ownership History
Date
Name
Owned For
Owner Type
Purchase Details
Closed on
Aug 19, 2020
Sold by
Ackerman Nelson L and Ackerman Annette M
Bought by
Ackerman Nelson Lee and Ackerman Annette
Current Estimated Value
Purchase Details
Closed on
Jun 16, 2008
Sold by
Moore Allen K and Moore Aubrey M
Bought by
Ackerman Nelson L and Ackerman Annette M
Home Financials for this Owner
Home Financials are based on the most recent Mortgage that was taken out on this home.
Original Mortgage
$211,500
Outstanding Balance
$135,267
Interest Rate
6.07%
Mortgage Type
Purchase Money Mortgage
Estimated Equity
$275,530
Purchase Details
Closed on
Jun 17, 2003
Sold by
Jaramillo Carlos
Bought by
Moore Allen K and Moore Aubrey M
Home Financials for this Owner
Home Financials are based on the most recent Mortgage that was taken out on this home.
Original Mortgage
$143,700
Interest Rate
5.56%
Mortgage Type
FHA
Create a Home Valuation Report for This Property
The Home Valuation Report is an in-depth analysis detailing your home's value as well as a comparison with similar homes in the area
Home Values in the Area
Average Home Value in this Area
Purchase History
| Date | Buyer | Sale Price | Title Company |
|---|---|---|---|
| Ackerman Nelson Lee | -- | None Available | |
| Ackerman Nelson L | -- | Fidelity Natl Title Ins Co | |
| Moore Allen K | -- | Fidelity Natl Title Ins Co |
Source: Public Records
Mortgage History
| Date | Status | Borrower | Loan Amount |
|---|---|---|---|
| Open | Ackerman Nelson L | $211,500 | |
| Previous Owner | Moore Allen K | $143,700 |
Source: Public Records
Tax History Compared to Growth
Tax History
| Year | Tax Paid | Tax Assessment Tax Assessment Total Assessment is a certain percentage of the fair market value that is determined by local assessors to be the total taxable value of land and additions on the property. | Land | Improvement |
|---|---|---|---|---|
| 2025 | $3,367 | $82,192 | $19,663 | $62,529 |
| 2024 | $3,367 | $79,798 | $19,090 | $60,708 |
| 2023 | $3,311 | $77,474 | $18,534 | $58,940 |
| 2022 | $3,199 | $75,218 | $17,995 | $57,223 |
| 2021 | $3,092 | $73,028 | $17,471 | $55,557 |
| 2020 | $3,041 | $70,901 | $16,962 | $53,939 |
| 2019 | $2,952 | $68,836 | $16,468 | $52,368 |
| 2018 | $2,847 | $68,836 | $16,468 | $52,368 |
| 2017 | $2,759 | $66,831 | $15,988 | $50,843 |
| 2016 | $2,680 | $62,996 | $15,071 | $47,925 |
| 2015 | $61,161 | $61,161 | $14,632 | $46,529 |
| 2014 | $2,597 | $61,161 | $14,632 | $46,529 |
| 2013 | -- | $61,161 | $14,632 | $46,529 |
Source: Public Records
Map
Nearby Homes
- 4309 Rancho Largo Rd NW
- 4320 La Paloma Rd NW
- 4512 Waynesboro Rd NW
- 8100 Rancho Viejo Ct NW
- 7739 Ridgeview Dr NW
- 7824 Snowberry St NW
- 7809 Juneberry St NW
- 4600 Waynesboro Place NW
- 4515 Millwood Ct NW
- 8416 Calle Primera NW
- 7816 Bursera Dr NW
- 4300 Ridgemont Ave NW
- 8416 Rancho Colina NW
- 4820 Summersville Dr NW
- 8204 Rancho Paraiso NW
- 3920 Rancho Centro NW
- 7939 Independence Dr NW
- 7434 Riverton Dr NW
- 4500 Samara Rd NW
- 7516 Wells Fargo Trail NW
- 4324 Rancho Centro NW
- 4320 Rancho Centro NW
- 4328 Rancho Centro NW
- 4316 Rancho Centro NW
- 4332 Rancho Centro NW
- 8101 Rancho Cielo NW
- 8100 Rancho Cielo NW
- 4401 Rancho Largo Rd NW
- 4400 Rancho Centro NW
- 4331 Rancho Largo Rd NW
- 8105 Rancho Cielo NW
- 4327 Rancho Largo Rd NW
- 4401 Rancho Centro Ct NW
- 8104 Rancho Cielo NW
- 4405 Rancho Largo Rd NW
- 4323 Rancho Largo Rd NW
- 4308 Rancho Centro NW
- 8101 Rancho Sueno Ct NW
- 8101 Rancho Sueno Ct NW
- 4404 Rancho Centro NW