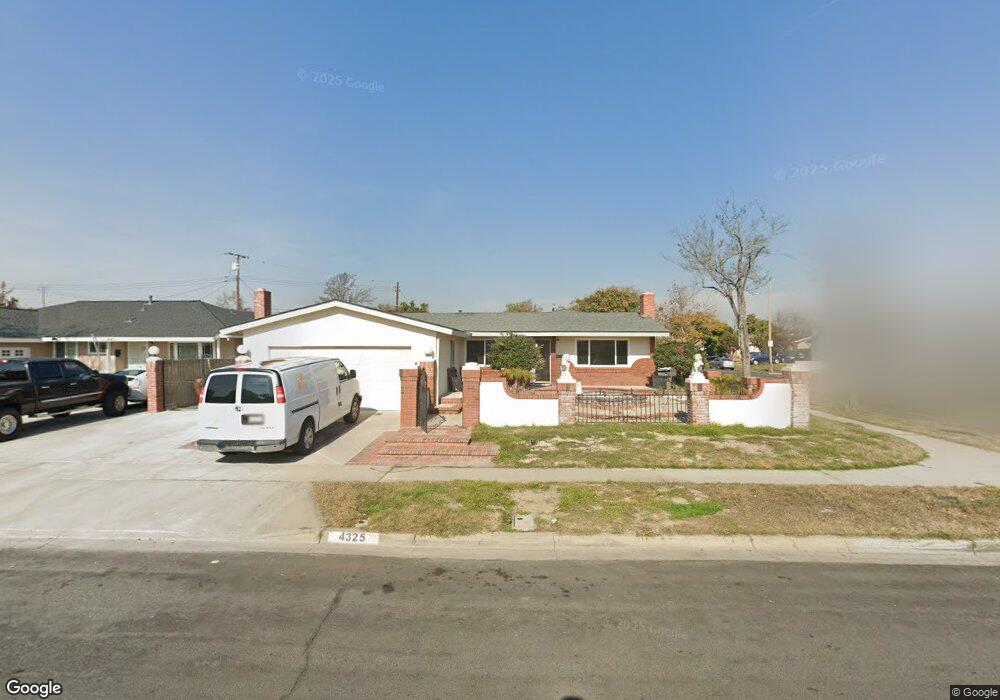
4325 Oakfield Ave Santa Ana, CA 92703
Riverview West NeighborhoodEstimated Value: $812,000 - $976,000
3
Beds
2
Baths
1,162
Sq Ft
$781/Sq Ft
Est. Value
About This Home
This home is located at 4325 Oakfield Ave, Santa Ana, CA 92703 and is currently estimated at $907,999, approximately $781 per square foot. 4325 Oakfield Ave is a home located in Orange County with nearby schools including R. F. Hazard Elementary School, James Irvine Intermediate School, and Santiago High School.
Ownership History
Date
Name
Owned For
Owner Type
Purchase Details
Closed on
Oct 18, 2024
Sold by
Le Tam Minh and Nghiem Huong
Bought by
Tam Minh Le And Huong Nghiem Living Trust and Le
Current Estimated Value
Purchase Details
Closed on
Jun 9, 2021
Sold by
Le Thang Chien and Nguyen Tu Thi
Bought by
Le Tam Minh and Nghiem Huong
Home Financials for this Owner
Home Financials are based on the most recent Mortgage that was taken out on this home.
Original Mortgage
$400,000
Interest Rate
2.9%
Mortgage Type
New Conventional
Purchase Details
Closed on
Jan 23, 2013
Sold by
Lu Thang Chien and Nguyen Tu Thi
Bought by
Le Thang Chien and Nguyen Tu Thi
Home Financials for this Owner
Home Financials are based on the most recent Mortgage that was taken out on this home.
Original Mortgage
$126,530
Interest Rate
3.32%
Mortgage Type
New Conventional
Create a Home Valuation Report for This Property
The Home Valuation Report is an in-depth analysis detailing your home's value as well as a comparison with similar homes in the area
Home Values in the Area
Average Home Value in this Area
Purchase History
| Date | Buyer | Sale Price | Title Company |
|---|---|---|---|
| Tam Minh Le And Huong Nghiem Living Trust | -- | None Listed On Document | |
| Le Tam Minh | $580,000 | Wfg National Title Company | |
| Le Thang Chien | -- | Servicelink |
Source: Public Records
Mortgage History
| Date | Status | Borrower | Loan Amount |
|---|---|---|---|
| Previous Owner | Le Tam Minh | $400,000 | |
| Previous Owner | Le Thang Chien | $126,530 |
Source: Public Records
Tax History Compared to Growth
Tax History
| Year | Tax Paid | Tax Assessment Tax Assessment Total Assessment is a certain percentage of the fair market value that is determined by local assessors to be the total taxable value of land and additions on the property. | Land | Improvement |
|---|---|---|---|---|
| 2025 | $9,688 | $846,993 | $565,271 | $281,722 |
| 2024 | $9,688 | $821,850 | $554,187 | $267,663 |
| 2023 | $7,112 | $603,432 | $543,321 | $60,111 |
| 2022 | $6,954 | $591,600 | $532,667 | $58,933 |
| 2021 | $3,710 | $305,930 | $234,300 | $71,630 |
| 2020 | $3,664 | $302,794 | $231,898 | $70,896 |
| 2019 | $3,616 | $296,857 | $227,351 | $69,506 |
| 2018 | $3,526 | $291,037 | $222,893 | $68,144 |
| 2017 | $3,490 | $285,331 | $218,523 | $66,808 |
| 2016 | $3,338 | $279,737 | $214,238 | $65,499 |
| 2015 | $3,293 | $275,536 | $211,020 | $64,516 |
| 2014 | $3,214 | $270,139 | $206,886 | $63,253 |
Source: Public Records
Map
Nearby Homes
- 1114 N Gates St
- 526 W Tribella Ct
- 4201 W 5th St Unit 314
- 1609 N Parsons Place
- 4248 W 5th St
- 3929 W 5th St Unit 16
- 11321 Parkgreen Ln Unit 102
- 3625 W 11th St
- 1314 N Bewley St
- 3932 W 5th St Unit 202
- 13322 Euclid St
- 4832 W 5th St Unit B
- 702 N Gunther St
- 10886 Lotus Dr
- 230 Green Dr
- 4518 W 1st St
- 323 N Euclid St Unit 99
- 3424 W Washington Ave Unit 228
- 3424 W Washington Ave Unit 309
- 5317 Silver Dr
- 4401 Oakfield Ave
- 4405 Oakfield Ave
- 4326 W Maurie Ave
- 4402 W Maurie Ave
- 1201 N Mountain View St
- 1205 N Mountain View St
- 4406 W Maurie Ave
- 4409 Oakfield Ave
- 1209 N Mountain View St
- 4326 Oakfield Ave
- 4322 Oakfield Ave
- 4402 Oakfield Ave
- 4410 W Maurie Ave
- 4406 Oakfield Ave
- 4318 Oakfield Ave
- 1213 N Mountain View St
- 4413 Oakfield Ave
- 1202 N Hastings St
- 4410 Oakfield Ave
- 4314 Oakfield Ave