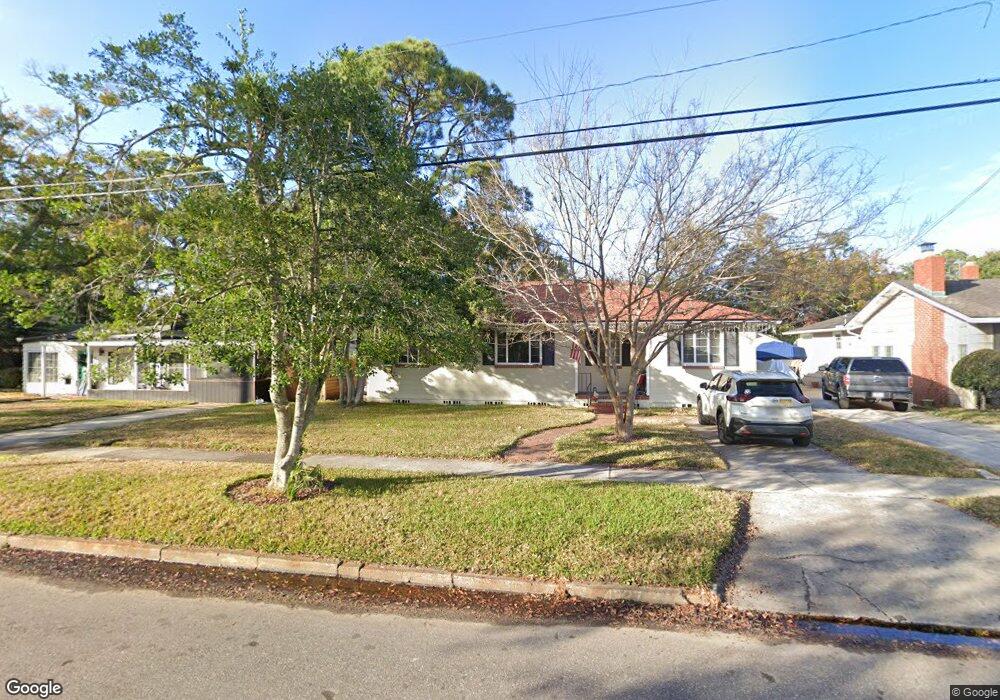
4327 Genoa Ave Jacksonville, FL 32210
Ortega NeighborhoodEstimated Value: $304,838 - $325,000
3
Beds
1
Bath
1,306
Sq Ft
$238/Sq Ft
Est. Value
About This Home
This home is located at 4327 Genoa Ave, Jacksonville, FL 32210 and is currently estimated at $310,960, approximately $238 per square foot. 4327 Genoa Ave is a home located in Duval County with nearby schools including Venetia Elementary School, Lake Shore Middle School, and Riverside High School.
Ownership History
Date
Name
Owned For
Owner Type
Purchase Details
Closed on
May 1, 2002
Sold by
Olson Pamela Michelle and Olson Peter J
Bought by
Haines Richard H and Haines Charlotte A
Current Estimated Value
Home Financials for this Owner
Home Financials are based on the most recent Mortgage that was taken out on this home.
Original Mortgage
$125,924
Outstanding Balance
$54,107
Interest Rate
7.18%
Mortgage Type
FHA
Estimated Equity
$256,853
Purchase Details
Closed on
Jun 17, 1997
Sold by
Little Richard R and Farmer John D
Bought by
Porter Dale Pamela Michelle
Home Financials for this Owner
Home Financials are based on the most recent Mortgage that was taken out on this home.
Original Mortgage
$58,900
Interest Rate
7.97%
Purchase Details
Closed on
Jun 9, 1997
Sold by
Pike Melinda Lee
Bought by
Porter Dale Pamela Michelle
Home Financials for this Owner
Home Financials are based on the most recent Mortgage that was taken out on this home.
Original Mortgage
$58,900
Interest Rate
7.97%
Create a Home Valuation Report for This Property
The Home Valuation Report is an in-depth analysis detailing your home's value as well as a comparison with similar homes in the area
Home Values in the Area
Average Home Value in this Area
Purchase History
| Date | Buyer | Sale Price | Title Company |
|---|---|---|---|
| Haines Richard H | $127,000 | -- | |
| Porter Dale Pamela Michelle | $100 | -- | |
| Porter Dale Pamela Michelle | $62,000 | -- |
Source: Public Records
Mortgage History
| Date | Status | Borrower | Loan Amount |
|---|---|---|---|
| Open | Haines Richard H | $125,924 | |
| Previous Owner | Porter Dale Pamela Michelle | $58,900 |
Source: Public Records
Tax History Compared to Growth
Tax History
| Year | Tax Paid | Tax Assessment Tax Assessment Total Assessment is a certain percentage of the fair market value that is determined by local assessors to be the total taxable value of land and additions on the property. | Land | Improvement |
|---|---|---|---|---|
| 2025 | $1,579 | $121,092 | -- | -- |
| 2024 | $1,526 | $117,680 | -- | -- |
| 2023 | $1,526 | $114,253 | $0 | $0 |
| 2022 | $1,386 | $110,926 | $0 | $0 |
| 2021 | $1,367 | $107,696 | $0 | $0 |
| 2020 | $1,349 | $106,210 | $0 | $0 |
| 2019 | $1,327 | $103,823 | $0 | $0 |
| 2018 | $1,304 | $101,888 | $0 | $0 |
| 2017 | $1,282 | $99,793 | $0 | $0 |
| 2016 | $1,268 | $97,741 | $0 | $0 |
| 2015 | $1,279 | $97,062 | $0 | $0 |
| 2014 | $1,279 | $96,292 | $0 | $0 |
Source: Public Records
Map
Nearby Homes
- 4356 Demedici Ave
- 4350 Garibaldi Ave
- 0 Venetia Blvd
- 4358 Timuquana Rd Unit 148
- 4245 Timuquana Rd
- 4350 Venetia Blvd
- 4311 Venetia Blvd
- 4341 Venetia Blvd
- 4551 Blount Ave
- 4636 Timuquana Rd
- 4652 Blount Ave
- 5035 Long Bow Rd
- 4966 Arapahoe Ave
- 4805 Algonquin Ave
- 4727 Carlisle Rd
- 5375 Ortega Farms Blvd Unit 609
- 5375 Ortega Farms Blvd Unit 309
- 5375 Ortega Farms Blvd Unit 908
- 5375 Ortega Farms Blvd Unit 1110
- 5375 Ortega Farms Blvd Unit 510
- 4333 Genoa Ave
- 4321 Genoa Ave
- 4326 Davinci Ave
- 4339 Genoa Ave
- 4320 Davinci Ave
- 4332 Davinci Ave
- 4313 Genoa Ave
- 4305 Genoa Ave
- 4338 Davinci Ave
- 4314 Davinci Ave
- 4345 Genoa Ave
- 4330 Genoa Ave
- 4320 Genoa Ave
- 4344 Davinci Ave
- 4336 Genoa Ave
- 4314 Genoa Ave
- 4351 Genoa Ave
- 5344 Diaz Place
- 4344 Genoa Ave
- 4302 Davinci Ave