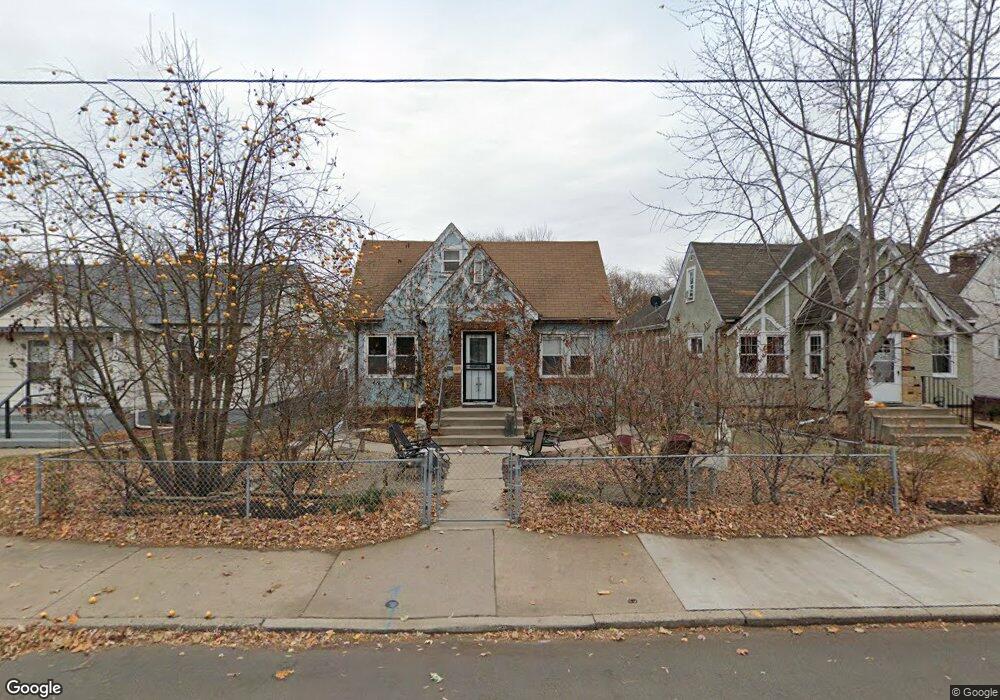
4329 28th Ave S Minneapolis, MN 55406
Ericsson NeighborhoodEstimated Value: $359,000 - $414,000
2
Beds
2
Baths
1,460
Sq Ft
$261/Sq Ft
Est. Value
About This Home
This home is located at 4329 28th Ave S, Minneapolis, MN 55406 and is currently estimated at $381,745, approximately $261 per square foot. 4329 28th Ave S is a home located in Hennepin County with nearby schools including Northrop Elementary School, Sanford Middle School, and Roosevelt Senior High School.
Ownership History
Date
Name
Owned For
Owner Type
Purchase Details
Closed on
Jan 16, 2018
Sold by
James Marko and Gagnon Viola R
Bought by
James Marko
Current Estimated Value
Home Financials for this Owner
Home Financials are based on the most recent Mortgage that was taken out on this home.
Original Mortgage
$179,050
Outstanding Balance
$141,937
Interest Rate
3.93%
Mortgage Type
New Conventional
Estimated Equity
$239,808
Purchase Details
Closed on
Oct 11, 2011
Sold by
Gagnon Viola R
Bought by
Gagnon Viola R and James Marko
Home Financials for this Owner
Home Financials are based on the most recent Mortgage that was taken out on this home.
Original Mortgage
$184,577
Interest Rate
4.25%
Mortgage Type
FHA
Purchase Details
Closed on
Dec 1, 2006
Sold by
Johnson Alicia E and Ortiz Blanca
Bought by
Gagnon Viola R
Purchase Details
Closed on
Sep 6, 2000
Sold by
Hruby Greg E
Bought by
Ortiz Julio and Ortiz Blanca
Purchase Details
Closed on
Aug 25, 1999
Sold by
Riess Curt L and Riess Darcy A H
Bought by
Hroby Greg E
Create a Home Valuation Report for This Property
The Home Valuation Report is an in-depth analysis detailing your home's value as well as a comparison with similar homes in the area
Home Values in the Area
Average Home Value in this Area
Purchase History
| Date | Buyer | Sale Price | Title Company |
|---|---|---|---|
| James Marko | -- | None Available | |
| Gagnon Viola R | -- | Land Title Inc | |
| Gagnon Viola R | $232,000 | -- | |
| Ortiz Julio | $160,000 | -- | |
| Hroby Greg E | $135,000 | -- |
Source: Public Records
Mortgage History
| Date | Status | Borrower | Loan Amount |
|---|---|---|---|
| Open | James Marko | $179,050 | |
| Closed | Gagnon Viola R | $184,577 |
Source: Public Records
Tax History Compared to Growth
Tax History
| Year | Tax Paid | Tax Assessment Tax Assessment Total Assessment is a certain percentage of the fair market value that is determined by local assessors to be the total taxable value of land and additions on the property. | Land | Improvement |
|---|---|---|---|---|
| 2024 | $5,292 | $369,000 | $124,000 | $245,000 |
| 2023 | $5,154 | $397,000 | $119,000 | $278,000 |
| 2022 | $4,156 | $387,000 | $100,000 | $287,000 |
| 2021 | $4,019 | $308,500 | $63,000 | $245,500 |
| 2020 | $3,876 | $308,500 | $68,100 | $240,400 |
| 2019 | $3,995 | $278,000 | $45,400 | $232,600 |
| 2018 | $3,777 | $278,000 | $45,400 | $232,600 |
| 2017 | $3,489 | $227,500 | $41,300 | $186,200 |
| 2016 | $3,266 | $208,000 | $41,300 | $166,700 |
| 2015 | $3,097 | $190,000 | $41,300 | $148,700 |
| 2014 | -- | $190,000 | $41,300 | $148,700 |
Source: Public Records
Map
Nearby Homes
- 4244 28th Ave S
- 4400 29th Ave S
- 4225 28th Ave S
- 4217 27th Ave S
- 4224 30th Ave S
- 4436 29th Ave S
- 4356 Nokomis Ave
- 4516 29th Ave S
- 4222 25th Ave S
- 4126 31st Ave S
- 4552 Nokomis Ave
- 4129 23rd Ave S
- 4201 33rd Ave S
- 4125 23rd Ave S
- 4332 34th Ave S
- 3947 28th Ave S
- 3945 30th Ave S
- 4236 22nd Ave S
- 3941 30th Ave S
- 4053 Standish Ave
- 4333 28th Ave S
- 4325 28th Ave S
- 4325 S 28th Ave
- 4337 28th Ave S
- 4321 28th Ave S
- 4317 28th Ave S
- 4341 28th Ave S
- 4328 29th Ave S
- 4332 29th Ave S
- 4324 29th Ave S
- 4324 4324 29th-Avenue-s
- 4345 28th Ave S
- 4313 28th Ave S
- 4336 29th Ave S
- 4320 29th Ave S
- 4340 29th Ave S
- 4316 29th Ave S
- 4328 28th Ave S
- 4332 28th Ave S
- 4324 28th Ave S