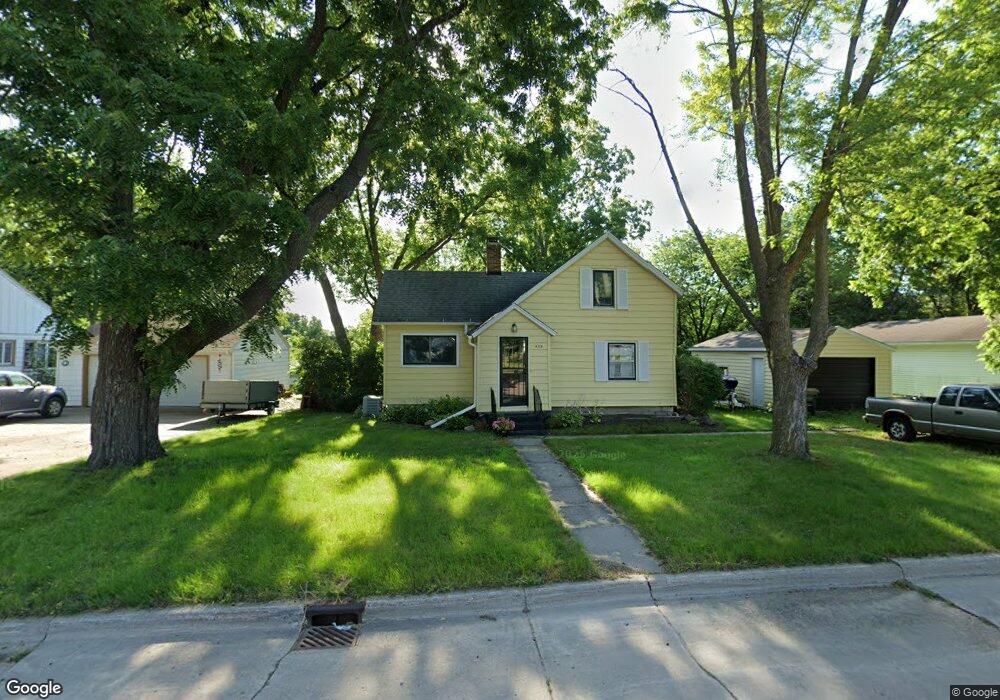
433 11th St SE Unit 433 SE Eleventh Stre Waseca, MN 56093
Estimated Value: $128,000 - $181,000
2
Beds
2
Baths
676
Sq Ft
$235/Sq Ft
Est. Value
About This Home
This home is located at 433 11th St SE Unit 433 SE Eleventh Stre, Waseca, MN 56093 and is currently estimated at $159,138, approximately $235 per square foot. 433 11th St SE Unit 433 SE Eleventh Stre is a home located in Waseca County with nearby schools including Hartley Elementary School, Waseca Intermediate School, and Waseca Junior High School.
Ownership History
Date
Name
Owned For
Owner Type
Purchase Details
Closed on
Feb 20, 2023
Sold by
Nelson Yvonne
Bought by
Cavanaugh Avery
Current Estimated Value
Home Financials for this Owner
Home Financials are based on the most recent Mortgage that was taken out on this home.
Original Mortgage
$141,126
Outstanding Balance
$136,817
Interest Rate
6.48%
Mortgage Type
New Conventional
Estimated Equity
$22,321
Purchase Details
Closed on
Apr 25, 2022
Sold by
Slattery Carson
Bought by
Nelson Yvonne
Home Financials for this Owner
Home Financials are based on the most recent Mortgage that was taken out on this home.
Original Mortgage
$114,578
Interest Rate
3.85%
Mortgage Type
New Conventional
Purchase Details
Closed on
Apr 17, 2020
Sold by
Anderson Jason T
Bought by
Slattery Carson
Purchase Details
Closed on
Jan 11, 2019
Sold by
Rollag Gloria R
Bought by
Anderson Jason T
Create a Home Valuation Report for This Property
The Home Valuation Report is an in-depth analysis detailing your home's value as well as a comparison with similar homes in the area
Home Values in the Area
Average Home Value in this Area
Purchase History
| Date | Buyer | Sale Price | Title Company |
|---|---|---|---|
| Cavanaugh Avery | $151,350 | -- | |
| Nelson Yvonne | $115,000 | -- | |
| Slattery Carson | $80,000 | North American Title | |
| Anderson Jason T | $57,000 | None Available |
Source: Public Records
Mortgage History
| Date | Status | Borrower | Loan Amount |
|---|---|---|---|
| Open | Cavanaugh Avery | $141,126 | |
| Previous Owner | Nelson Yvonne | $114,578 |
Source: Public Records
Tax History Compared to Growth
Tax History
| Year | Tax Paid | Tax Assessment Tax Assessment Total Assessment is a certain percentage of the fair market value that is determined by local assessors to be the total taxable value of land and additions on the property. | Land | Improvement |
|---|---|---|---|---|
| 2024 | $1,888 | $148,100 | $42,500 | $105,600 |
| 2023 | $1,508 | $119,500 | $31,700 | $87,800 |
| 2022 | $1,084 | $91,300 | $44,400 | $46,900 |
| 2021 | $978 | $79,600 | $38,700 | $40,900 |
| 2020 | $950 | $73,600 | $35,800 | $37,800 |
| 2019 | $864 | $70,300 | $34,300 | $36,000 |
| 2018 | $910 | $63,300 | $30,800 | $32,500 |
| 2017 | $812 | $41,100 | $18,480 | $22,620 |
| 2016 | $806 | $39,100 | $17,538 | $21,562 |
| 2015 | -- | $38,200 | $17,178 | $21,022 |
| 2012 | -- | $42,200 | $17,144 | $25,056 |
Source: Public Records
Map
Nearby Homes
- 900 10th St SE
- 929 Elm Ave E
- 414 8th St SE
- 708 8th St SE
- 706 4th Ave SE
- 621 Elm Ave E
- 522 2nd Ave NE
- 312 2nd Ave SE
- 208 9th Ave SE
- 209 10th Ave SE
- 117 2nd St NE Unit 120 2nd Ave NE
- 414 3rd St NE
- 616 State St S
- 14435 Woodville Dr
- 504 State St N
- 210 7th Ave NE
- 521 6th St SW
- 217 11th Avenue Ct NE
- 34365 Old Highway 13
- 15035 355th Ave
- 433 11th St SE
- 433 11th St SE Unit 433 11th Street SE
- 425 11th St SE
- 439 11th St SE
- 1105 5th Ave SE
- 420 12th St SE
- 424 12th St SE
- 806 806 11th St SE
- 432 11th St SE
- 432 11th St SE
- 419 11th St SE
- 416 12th St SE
- 428 11th St SE
- 428 12th St SE
- 424 11th St SE
- 440 11th St SE
- 412 12th St SE
- 420 11th St SE
- 415 11th St SE
- 1216 12th Street Cir SE