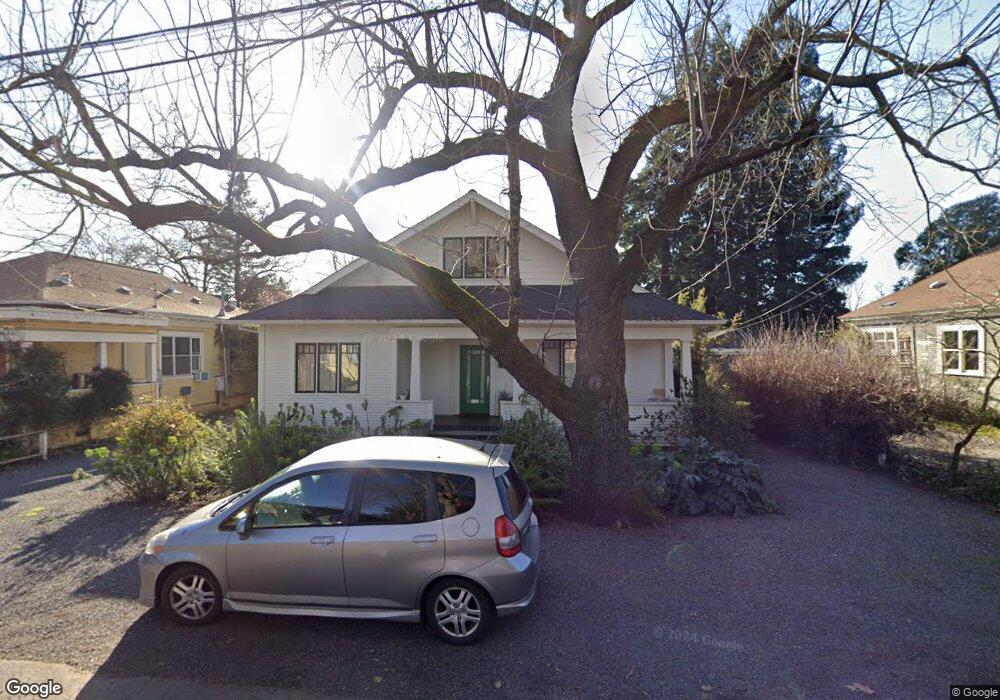
433 Goodman Ave Santa Rosa, CA 95407
Estimated Value: $515,000 - $725,000
3
Beds
2
Baths
1,558
Sq Ft
$395/Sq Ft
Est. Value
About This Home
This home is located at 433 Goodman Ave, Santa Rosa, CA 95407 and is currently estimated at $616,055, approximately $395 per square foot. 433 Goodman Ave is a home located in Sonoma County with nearby schools including Elsie Allen High School, Kid Street Charter School, and St. Michael's Orthodox School.
Ownership History
Date
Name
Owned For
Owner Type
Purchase Details
Closed on
May 31, 2018
Sold by
Malone Justine and Malone Justine
Bought by
Malone Justine
Current Estimated Value
Home Financials for this Owner
Home Financials are based on the most recent Mortgage that was taken out on this home.
Original Mortgage
$312,000
Outstanding Balance
$229,488
Interest Rate
4.5%
Mortgage Type
New Conventional
Estimated Equity
$386,567
Purchase Details
Closed on
Aug 29, 2013
Sold by
Malone Paul
Bought by
Malone Justine
Purchase Details
Closed on
Jun 11, 2001
Sold by
Hill Harold M and Hill Clair L
Bought by
Malone Justine and Wolterbeek Paul
Home Financials for this Owner
Home Financials are based on the most recent Mortgage that was taken out on this home.
Original Mortgage
$188,700
Interest Rate
7.14%
Mortgage Type
Seller Take Back
Create a Home Valuation Report for This Property
The Home Valuation Report is an in-depth analysis detailing your home's value as well as a comparison with similar homes in the area
Home Values in the Area
Average Home Value in this Area
Purchase History
| Date | Buyer | Sale Price | Title Company |
|---|---|---|---|
| Malone Justine | -- | First American Title Co | |
| Malone Justine | -- | None Available | |
| Malone Justine | $214,500 | Fidelity National Title Co |
Source: Public Records
Mortgage History
| Date | Status | Borrower | Loan Amount |
|---|---|---|---|
| Open | Malone Justine | $312,000 | |
| Closed | Malone Justine | $188,700 |
Source: Public Records
Tax History Compared to Growth
Tax History
| Year | Tax Paid | Tax Assessment Tax Assessment Total Assessment is a certain percentage of the fair market value that is determined by local assessors to be the total taxable value of land and additions on the property. | Land | Improvement |
|---|---|---|---|---|
| 2025 | $4,465 | $400,446 | $188,347 | $212,099 |
| 2024 | $4,465 | $392,595 | $184,654 | $207,941 |
| 2023 | $4,465 | $384,898 | $181,034 | $203,864 |
| 2022 | $4,210 | $377,352 | $177,485 | $199,867 |
| 2021 | $4,155 | $369,954 | $174,005 | $195,949 |
| 2020 | $4,045 | $366,161 | $172,221 | $193,940 |
| 2019 | $3,994 | $358,983 | $168,845 | $190,138 |
| 2018 | $3,957 | $351,945 | $165,535 | $186,410 |
| 2017 | $3,871 | $345,045 | $162,290 | $182,755 |
| 2016 | $3,838 | $338,280 | $159,108 | $179,172 |
| 2015 | $3,687 | $333,200 | $156,719 | $176,481 |
| 2014 | $3,558 | $326,674 | $153,650 | $173,024 |
Source: Public Records
Map
Nearby Homes
- 780 Dutton Ave
- 433 Blythewood Place
- 517 Boyd St
- 816 Boyd St Unit 4
- 209 Decoe St
- 151 Earle St
- 1447 Beachwood Dr
- 164 N Dutton Ave Unit 7
- 1245 Olive St
- 415 Duncan St
- 0 West Ave Unit 325019616
- 497 Sebastopol Ave
- 62 Romani Ct
- 70 Romani Ct
- 303 Hewett St
- 59 Roundelay Ln
- 100 W 8th St
- 1630 Mathwig Dr
- 1911 Corby Ave
- 1538 Surrey Dr
- 437 Goodman Ave
- 427 Goodman Ave
- 443 Goodman Ave
- 425 Goodman Ave
- 451 Goodman Ave
- 434 Goodman Ave
- 440 Goodman Ave
- 450 Goodman Ave
- 654 Dutton Ave
- 584 Dutton Ave
- 422 Goodman Ave
- 415 Goodman Ave
- 430 Goodman Ave
- 457 Goodman Ave
- 454 Goodman Ave
- 418 Goodman Ave
- 456 Goodman Ave
- 568 Dutton Ave
- 606 Dutton Ave
- 630 Dutton Ave