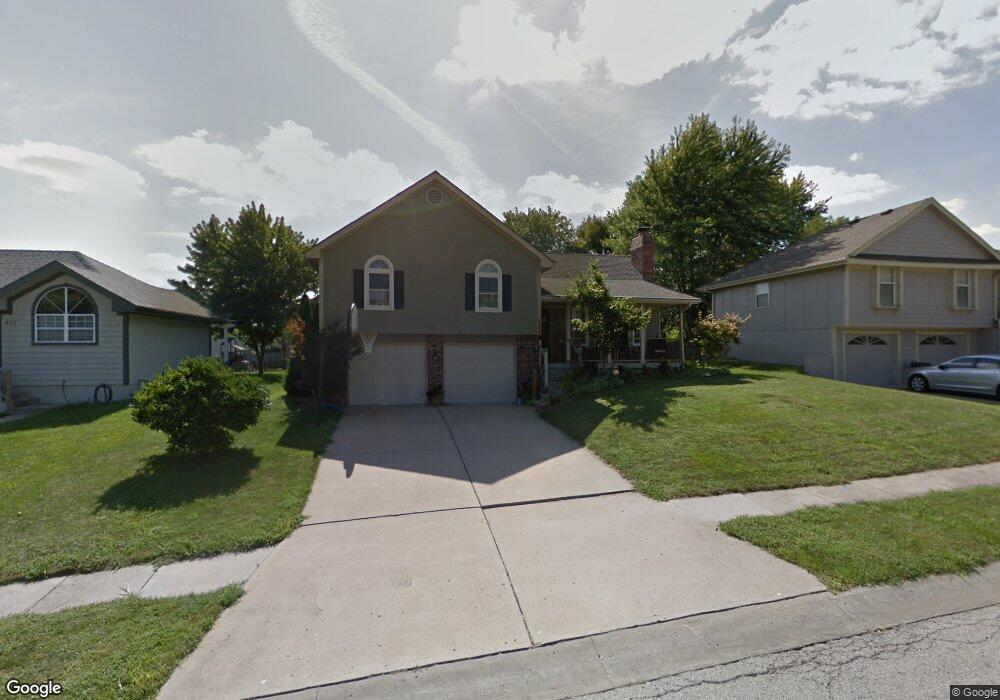
433 NE Station Dr Lees Summit, MO 64086
Estimated Value: $321,000 - $333,000
3
Beds
2
Baths
1,430
Sq Ft
$227/Sq Ft
Est. Value
About This Home
This home is located at 433 NE Station Dr, Lees Summit, MO 64086 and is currently estimated at $324,437, approximately $226 per square foot. 433 NE Station Dr is a home located in Jackson County with nearby schools including Meadow Lane Elementary School, Bernard C. Campbell Middle School, and Lee's Summit North High School.
Ownership History
Date
Name
Owned For
Owner Type
Purchase Details
Closed on
Aug 13, 1998
Sold by
Thum James J and Thum Wendy A
Bought by
Weyeneth Mark A and Weyeneth Beth A
Current Estimated Value
Home Financials for this Owner
Home Financials are based on the most recent Mortgage that was taken out on this home.
Original Mortgage
$84,000
Outstanding Balance
$17,570
Interest Rate
6.95%
Mortgage Type
Purchase Money Mortgage
Estimated Equity
$306,867
Purchase Details
Closed on
Feb 24, 1997
Sold by
Howell Christopher D and Howell Sharon L
Bought by
Thum James J and Thum Wendy A
Home Financials for this Owner
Home Financials are based on the most recent Mortgage that was taken out on this home.
Original Mortgage
$89,980
Interest Rate
7.55%
Mortgage Type
FHA
Create a Home Valuation Report for This Property
The Home Valuation Report is an in-depth analysis detailing your home's value as well as a comparison with similar homes in the area
Home Values in the Area
Average Home Value in this Area
Purchase History
| Date | Buyer | Sale Price | Title Company |
|---|---|---|---|
| Weyeneth Mark A | -- | -- | |
| Thum James J | -- | Security Land Title Company |
Source: Public Records
Mortgage History
| Date | Status | Borrower | Loan Amount |
|---|---|---|---|
| Open | Weyeneth Mark A | $84,000 | |
| Previous Owner | Thum James J | $89,980 | |
| Closed | Weyeneth Mark A | $10,500 |
Source: Public Records
Tax History
| Year | Tax Paid | Tax Assessment Tax Assessment Total Assessment is a certain percentage of the fair market value that is determined by local assessors to be the total taxable value of land and additions on the property. | Land | Improvement |
|---|---|---|---|---|
| 2025 | $3,874 | $52,265 | $8,219 | $44,046 |
| 2024 | $3,846 | $53,656 | $6,403 | $47,253 |
| 2023 | $3,846 | $53,656 | $7,074 | $46,582 |
| 2022 | $3,190 | $39,520 | $4,808 | $34,712 |
| 2021 | $3,256 | $39,520 | $4,808 | $34,712 |
| 2020 | $2,996 | $36,004 | $4,808 | $31,196 |
| 2019 | $2,914 | $36,004 | $4,808 | $31,196 |
| 2018 | $2,733 | $31,334 | $4,184 | $27,150 |
| 2017 | $2,733 | $31,334 | $4,184 | $27,150 |
| 2016 | $2,633 | $29,887 | $4,693 | $25,194 |
Source: Public Records
Map
Nearby Homes
- 1300 NE Browning Ln
- 1108 NE Woodbury Ct
- 1217 NE Magnolia St
- .342 acres NE Victoria Dr
- 1404 NE Grand Ave
- 12505 S Woodlawn Dr
- 812 NE Mulberry St
- 400 NE Mulberry St
- 809 NE Cedar St
- 1708 NE Balboa St
- 928 NE Mulberry St
- 612 NE Florence Ave
- 816 NE Pollard St
- 1213 NE Ball Dr
- 1118 NE Deerbrook Terrace
- 1138 NE Mulberry St
- 403 NE Howard Ave
- 311 NE Arlington Cir
- 502 NE Ash St
- 1412 NE Ernest Way
- 431 NE Station Dr
- 435 NE Station Dr
- 429 NE Station Dr
- 430 NE Station Dr
- 437 NE Station Dr
- 428 NE Station Dr
- 432 NE Station Dr
- 1205 NE Buttonwood Ave
- 1209 NE Buttonwood Ave
- 426 NE Station Dr
- 439 NE Station Dr
- 434 NE Station Dr
- 1201 NE Buttonwood Ave
- 1213 NE Buttonwood Ave
- 427 NE Station Dr
- 424 NE Station Dr
- 436 NE Station Dr
- 1217 NE Buttonwood Ave
- 425 NE Station Dr
- 1238 NE Depot Dr
Your Personal Tour Guide
Ask me questions while you tour the home.