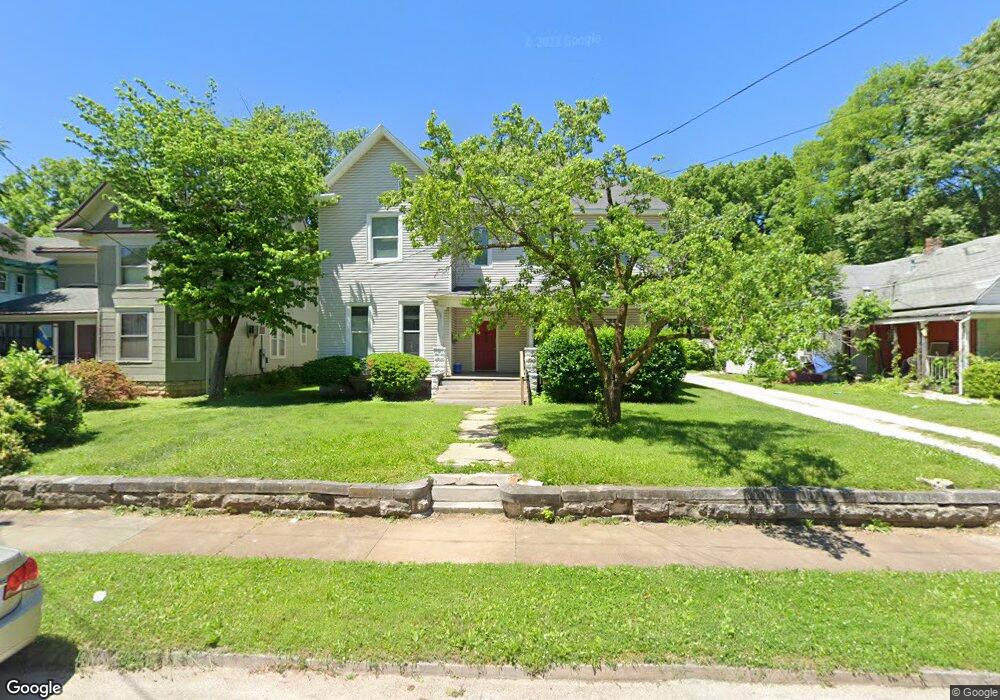
433 S Main Ave Springfield, MO 65806
West Central NeighborhoodEstimated Value: $296,000
4
Beds
4
Baths
3,440
Sq Ft
$86/Sq Ft
Est. Value
About This Home
This home is located at 433 S Main Ave, Springfield, MO 65806 and is currently estimated at $296,000, approximately $86 per square foot. 433 S Main Ave is a home located in Greene County with nearby schools including McGregor Elementary, Parkview High School, and St. Agnes Cathedral School.
Ownership History
Date
Name
Owned For
Owner Type
Purchase Details
Closed on
Dec 24, 2013
Sold by
Mulliner Richard R
Bought by
Kifer Thane H and Kifer Suzanne
Current Estimated Value
Purchase Details
Closed on
Jun 7, 2006
Sold by
Johnson Jeffrey and Johnson Kimberly
Bought by
Mulliner Richard R
Home Financials for this Owner
Home Financials are based on the most recent Mortgage that was taken out on this home.
Original Mortgage
$107,250
Interest Rate
6.56%
Mortgage Type
Future Advance Clause Open End Mortgage
Create a Home Valuation Report for This Property
The Home Valuation Report is an in-depth analysis detailing your home's value as well as a comparison with similar homes in the area
Home Values in the Area
Average Home Value in this Area
Purchase History
| Date | Buyer | Sale Price | Title Company |
|---|---|---|---|
| Kifer Thane H | -- | Shell Title Company | |
| Mulliner Richard R | -- | Meridian Title Company |
Source: Public Records
Mortgage History
| Date | Status | Borrower | Loan Amount |
|---|---|---|---|
| Previous Owner | Mulliner Richard R | $107,250 |
Source: Public Records
Tax History
| Year | Tax Paid | Tax Assessment Tax Assessment Total Assessment is a certain percentage of the fair market value that is determined by local assessors to be the total taxable value of land and additions on the property. | Land | Improvement |
|---|---|---|---|---|
| 2025 | $1,954 | $39,220 | $20,580 | $18,640 |
| 2024 | $2,104 | $39,220 | $20,580 | $18,640 |
| 2023 | $2,092 | $39,220 | $20,580 | $18,640 |
| 2022 | $1,977 | $36,200 | $20,580 | $15,620 |
| 2021 | $1,977 | $36,200 | $20,580 | $15,620 |
| 2020 | $2,067 | $36,200 | $20,580 | $15,620 |
| 2019 | $2,009 | $36,200 | $20,580 | $15,620 |
| 2018 | $1,997 | $35,990 | $20,580 | $15,410 |
| 2017 | $1,976 | $35,990 | $20,580 | $15,410 |
| 2016 | $1,972 | $35,990 | $20,580 | $15,410 |
| 2015 | $1,954 | $35,990 | $20,580 | $15,410 |
| 2014 | $1,545 | $28,240 | $20,580 | $7,660 |
Source: Public Records
Map
Nearby Homes
- 623 W Walnut St Unit 206
- 623 W Walnut St Unit 408
- 723 W Mount Vernon St
- 812 W Pershing St
- 817 W Walnut St
- 802 W Mount Vernon St
- 620 S Douglas Ave
- 823 W Walnut St
- 824 W Elm St
- 840 W Elm St
- 509 W Olive St Unit 201
- 509 W Olive St Unit 206
- 222 N 8th Ave W
- 630 W State St
- 924 W College St
- 816 W State St
- 742 S Douglas Ave
- 739 S Douglas Ave
- 327 E Walnut St Unit 203
- 411 W Page St
- 427 S Main Ave
- 437 S Main Ave
- 421 S Main Ave
- 445 S Main Ave
- 608 -614 W Walnut St
- 413 S Main Ave
- 434 S Main Ave
- 428 S Main Ave
- 436 S Main Ave
- 422 S Main Ave
- 440 S Main Ave
- 608 W Walnut St
- 459 S Main Ave
- 448 S Main Ave
- 620 W Walnut St
- 600 W Walnut St
- 461 S Main Ave
- 454 S Main Ave
- 430 S Grant Ave
- 446 S Grant Ave
Your Personal Tour Guide
Ask me questions while you tour the home.