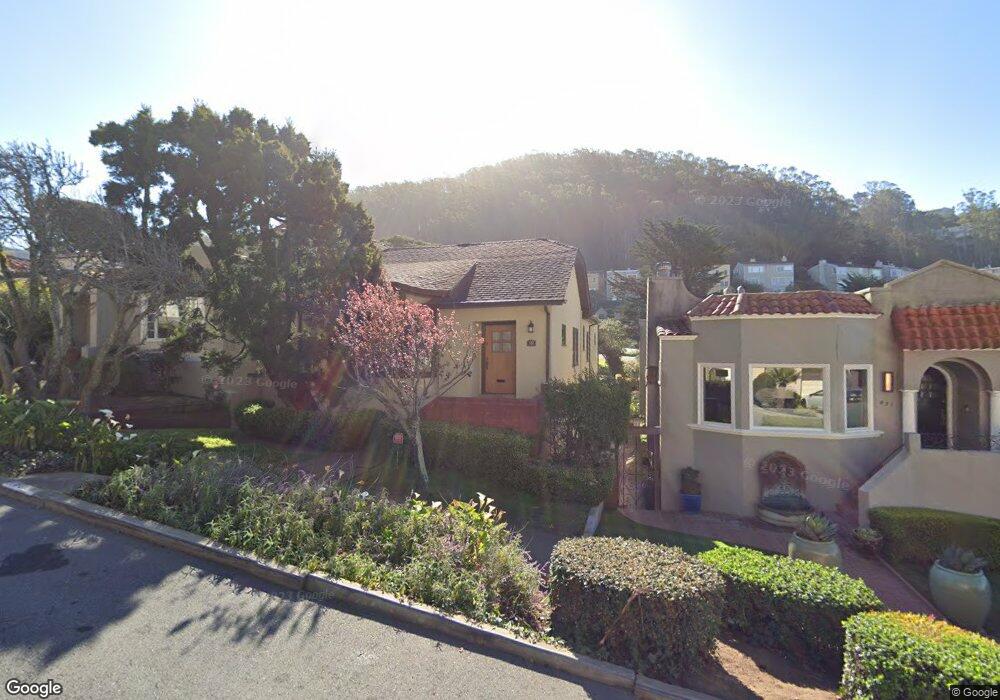
433 Ulloa St San Francisco, CA 94127
Laguna Honda NeighborhoodEstimated Value: $1,757,160 - $2,034,000
3
Beds
3
Baths
1,827
Sq Ft
$1,054/Sq Ft
Est. Value
About This Home
This home is located at 433 Ulloa St, San Francisco, CA 94127 and is currently estimated at $1,925,790, approximately $1,054 per square foot. 433 Ulloa St is a home located in San Francisco County with nearby schools including West Portal Elementary School, Hoover (Herbert) Middle School, and St. Brendan Elementary School.
Ownership History
Date
Name
Owned For
Owner Type
Purchase Details
Closed on
Jun 3, 2005
Sold by
Wong Jones D and Wong Sharon Q
Bought by
Wong Jones D and Wong Sharon Q
Current Estimated Value
Home Financials for this Owner
Home Financials are based on the most recent Mortgage that was taken out on this home.
Original Mortgage
$350,000
Interest Rate
5.84%
Mortgage Type
New Conventional
Purchase Details
Closed on
May 19, 2005
Sold by
Wong Jones D and Wong Sharon Q
Bought by
Wong Jones D and Wong Sharon Q
Home Financials for this Owner
Home Financials are based on the most recent Mortgage that was taken out on this home.
Original Mortgage
$350,000
Interest Rate
5.84%
Mortgage Type
New Conventional
Purchase Details
Closed on
Jan 3, 2002
Sold by
Wong Jones D and Wong Sharon Q
Bought by
Wong Jones D and Wong Sharon Q
Create a Home Valuation Report for This Property
The Home Valuation Report is an in-depth analysis detailing your home's value as well as a comparison with similar homes in the area
Home Values in the Area
Average Home Value in this Area
Purchase History
| Date | Buyer | Sale Price | Title Company |
|---|---|---|---|
| Wong Jones D | -- | -- | |
| Wong Jones D | -- | Financial Title | |
| Wong Jones D | -- | -- |
Source: Public Records
Mortgage History
| Date | Status | Borrower | Loan Amount |
|---|---|---|---|
| Closed | Wong Jones D | $350,000 |
Source: Public Records
Tax History Compared to Growth
Tax History
| Year | Tax Paid | Tax Assessment Tax Assessment Total Assessment is a certain percentage of the fair market value that is determined by local assessors to be the total taxable value of land and additions on the property. | Land | Improvement |
|---|---|---|---|---|
| 2025 | $2,838 | $244,600 | $56,104 | $188,496 |
| 2024 | $2,838 | $239,805 | $55,004 | $184,801 |
| 2023 | $2,797 | $235,105 | $53,926 | $181,179 |
| 2022 | $2,748 | $230,496 | $52,869 | $177,627 |
| 2021 | $2,700 | $225,978 | $51,833 | $174,145 |
| 2020 | $2,708 | $223,662 | $51,302 | $172,360 |
| 2019 | $2,616 | $219,278 | $50,297 | $168,981 |
| 2018 | $2,530 | $214,980 | $49,311 | $165,669 |
| 2017 | $2,500 | $210,766 | $48,345 | $162,421 |
| 2016 | $2,433 | $206,636 | $47,398 | $159,238 |
| 2015 | $2,403 | $203,535 | $46,687 | $156,848 |
| 2014 | $2,340 | $199,550 | $45,773 | $153,777 |
Source: Public Records
Map
Nearby Homes
- 327 Ulloa St
- 285 Edgehill Way
- 129 Edgehill Way
- 111 Edgehill Way
- 40 Dorchester Way
- 55 Balceta Ave
- 92 San Pablo Ave
- 44 Yerba Buena Ave
- 140 Magellan Ave
- 83 Panorama Dr
- 110 Santa Clara Ave
- 160 Wawona St
- 172 Panorama Dr
- 11 Encline Ct
- 2266 9th Ave
- 75 San Jacinto Way
- 1620 Plymouth Ave
- 600 Gennessee St
- 33 Rio Ct
- 726 Joost Ave