433 W 1st St Groveton, TX 75845
Estimated payment $1,784/month
About This Lot
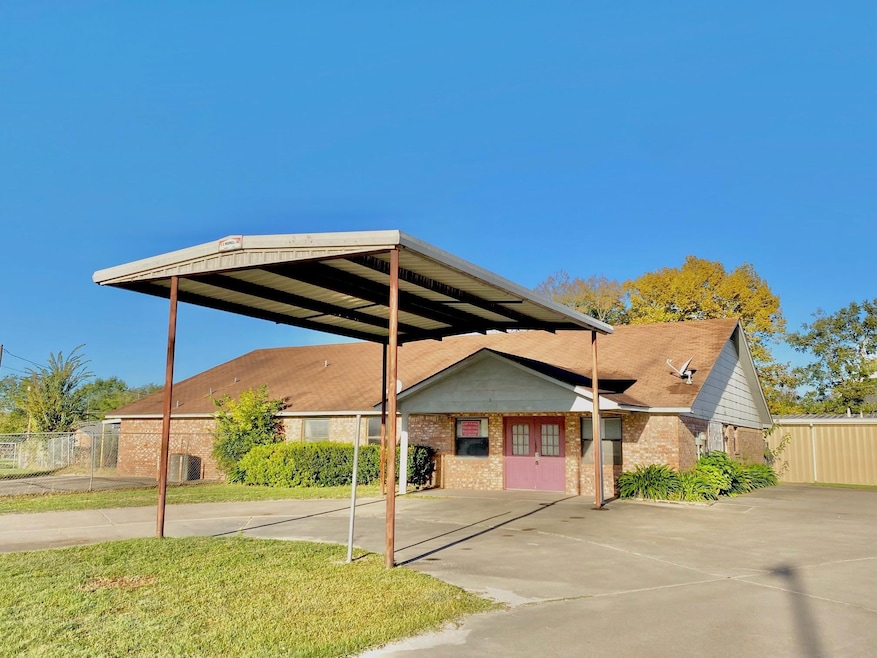
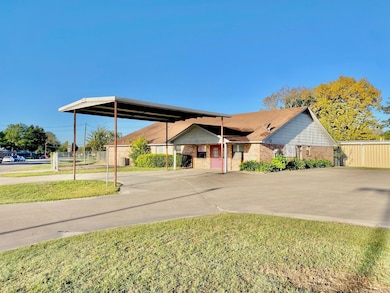
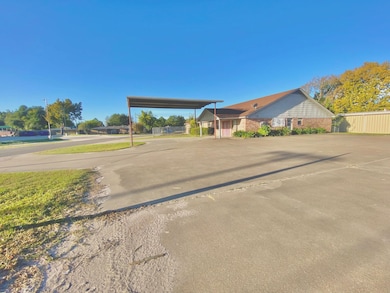
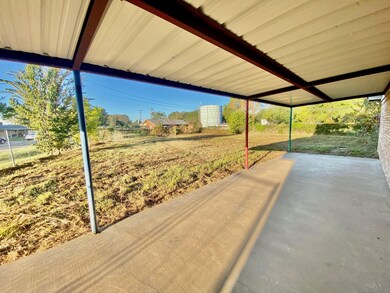
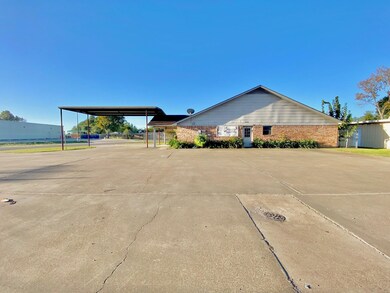
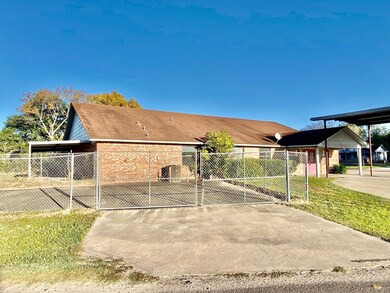
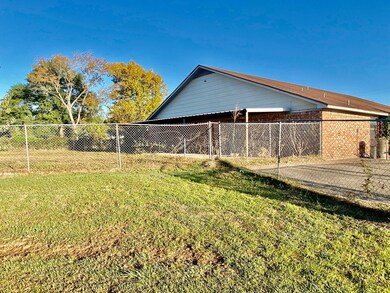
This is the perfect location to open a new business in downtown Groveton, TX. Located at the intersection of 1st Street and FM 2912, this building offers ample space and numerous rooms to run and operate a daycare, medical facility, or commercial office. Outside, youll appreciate the vast concrete parking area with pickup/drop off location for clients or patients beneath the large covered canopy. There are entry and exit doors on all four sides, three A/C units and a high chain link fence to the rear and side of the building. Inside is a large conference room, which could also be utilized as a waiting room and has access to a public mens and womens restrooms and a hallway with water fountain. There are five secluded office spaces throughout the building, two full restrooms with walk-in showers, and two kitchenettes. Storage spaces are located throughout, with at least 6 rooms to safe-keep files, documents, and supplies on the many built-in shelves. So, if this is the purchase opportunity youve been waiting for, schedule a showing today!

Property Details
Property Type
- Land
Est. Annual Taxes
- $2,491
Map
Home Values in the Area
Average Home Value in this Area
Tax History
| Year | Tax Paid | Tax Assessment Tax Assessment Total Assessment is a certain percentage of the fair market value that is determined by local assessors to be the total taxable value of land and additions on the property. | Land | Improvement |
|---|---|---|---|---|
| 2025 | $2,491 | $117,751 | $0 | $0 |
| 2024 | $2,076 | $286,850 | $30,949 | $255,901 |
| 2023 | $1,738 | $81,772 | $30,949 | $50,823 |
| 2022 | $1,949 | $81,772 | $30,949 | $50,823 |
| 2021 | $2,158 | $86,854 | $30,949 | $55,905 |
| 2020 | $1,836 | $71,186 | $3,423 | $67,763 |
| 2019 | $1,886 | $71,186 | $3,423 | $67,763 |
| 2018 | $1,973 | $74,274 | $3,423 | $70,851 |
| 2017 | $1,943 | $74,274 | $3,423 | $70,851 |
| 2016 | $1,965 | $74,274 | $3,423 | $70,851 |
| 2015 | -- | $74,274 | $3,423 | $70,851 |
| 2014 | -- | $76,530 | $3,423 | $73,107 |
Property History
| Date | Event | Price | List to Sale | Price per Sq Ft |
|---|---|---|---|---|
| 10/20/2023 10/20/23 | For Sale | $299,000 | -- | -- |
- Unit A 11823 Fm 355
- 436 Shadywood Dr
- 120 Lakeside Ct
- 393 Mason Loop
- 161 S Lakeway Cir
- 375 Lonesome Dove Trail
- 2529 Fm 356
- 74 Westwood Dr W
- 7 Meadowview Dr
- 22 Westwood Dr W
- 46 Fairway Dr
- 48 Fairway Dr
- 234 E Yaupon Oak
- 148 S Oak Bluff St
- 850 Triple Creek Loop
- 249 W Oak Lee Dr
- 114B Ava Ln
- 308 Trinlady Park
- 200 W Caroline St Unit B
- 299 Pine Harbor Dr