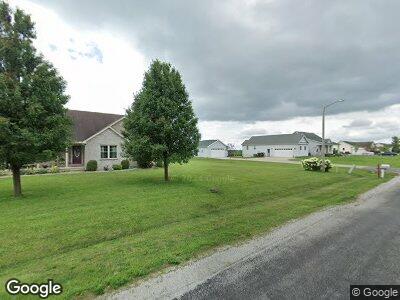
433 W Elm St Argenta, IL 62501
Estimated Value: $199,000 - $312,000
3
Beds
2
Baths
1,704
Sq Ft
$138/Sq Ft
Est. Value
About This Home
This home is located at 433 W Elm St, Argenta, IL 62501 and is currently estimated at $234,384, approximately $137 per square foot. 433 W Elm St is a home located in Macon County with nearby schools including Argenta-Oreana Elementary School, Argenta Oreana High School, and Argenta-Oreana Middle School.
Ownership History
Date
Name
Owned For
Owner Type
Purchase Details
Closed on
Jun 20, 2008
Sold by
Ferguson Kenny L
Bought by
Young Phillip C and Young Angela J
Current Estimated Value
Home Financials for this Owner
Home Financials are based on the most recent Mortgage that was taken out on this home.
Original Mortgage
$18,800
Interest Rate
6.05%
Mortgage Type
Future Advance Clause Open End Mortgage
Purchase Details
Closed on
Sep 21, 2007
Sold by
Hall Teresa E and Barnett Caroline A
Bought by
Ferguson Kenny L
Home Financials for this Owner
Home Financials are based on the most recent Mortgage that was taken out on this home.
Original Mortgage
$152,000
Interest Rate
6.66%
Mortgage Type
Construction
Purchase Details
Closed on
May 13, 2005
Sold by
Bennett L Gordon and Bennett Shirley M
Bought by
Hall Teresa E and Barnett Caroline A
Create a Home Valuation Report for This Property
The Home Valuation Report is an in-depth analysis detailing your home's value as well as a comparison with similar homes in the area
Home Values in the Area
Average Home Value in this Area
Purchase History
| Date | Buyer | Sale Price | Title Company |
|---|---|---|---|
| Young Phillip C | $188,500 | None Available | |
| Ferguson Kenny L | $17,500 | None Available | |
| Hall Teresa E | $16,000 | None Available |
Source: Public Records
Mortgage History
| Date | Status | Borrower | Loan Amount |
|---|---|---|---|
| Open | Young Phillip C | $160,000 | |
| Closed | Young Phillip C | $150,800 | |
| Closed | Young Phillip C | $18,800 | |
| Closed | Young Phillip C | $150,800 | |
| Previous Owner | Ferguson Kenny L | $152,000 |
Source: Public Records
Tax History Compared to Growth
Tax History
| Year | Tax Paid | Tax Assessment Tax Assessment Total Assessment is a certain percentage of the fair market value that is determined by local assessors to be the total taxable value of land and additions on the property. | Land | Improvement |
|---|---|---|---|---|
| 2023 | $6,142 | $72,769 | $7,288 | $65,481 |
| 2022 | $5,964 | $69,507 | $6,961 | $62,546 |
| 2021 | $5,856 | $66,022 | $6,612 | $59,410 |
| 2020 | $5,545 | $62,216 | $6,231 | $55,985 |
| 2019 | $5,545 | $62,216 | $6,231 | $55,985 |
| 2018 | $5,442 | $60,740 | $6,083 | $54,657 |
| 2017 | $5,468 | $60,997 | $6,109 | $54,888 |
| 2016 | $5,513 | $60,924 | $6,102 | $54,822 |
| 2015 | $5,106 | $59,149 | $5,924 | $53,225 |
| 2014 | $4,886 | $58,563 | $5,865 | $52,698 |
| 2013 | $4,882 | $58,563 | $5,865 | $52,698 |
Source: Public Records
Map
Nearby Homes
- 151 N Short St
- 205 E East St
- 290 E Broadway St
- 9010 E School Rd
- 9480 Caleb Rd
- 109 W Bower St
- 29 View Cir
- 13 View Cir
- 39 View Cir
- 5580 River Bluff Ct
- 9234 Cabin Rd
- 10093 Cabin Rd
- 9022 Sheets Rd
- 0 Birch Church Rd
- 245 N Main St
- 230 N Main St
- 260 N Sherman St
- 8070 Cerro Gordo Blacktop
- 8527 Sawyer Rd
- 3320 Star Route Rd