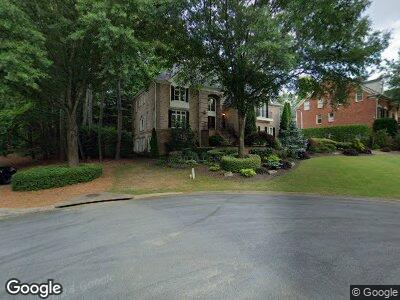
4331 Edgemere Dr Unit 1 Marietta, GA 30062
Estimated Value: $1,142,000 - $1,313,000
4
Beds
4
Baths
4,366
Sq Ft
$279/Sq Ft
Est. Value
About This Home
This home is located at 4331 Edgemere Dr Unit 1, Marietta, GA 30062 and is currently estimated at $1,218,196, approximately $279 per square foot. 4331 Edgemere Dr Unit 1 is a home located in Cobb County with nearby schools including Timber Ridge Elementary School, Dodgen Middle School, and Pope High School.
Ownership History
Date
Name
Owned For
Owner Type
Purchase Details
Closed on
Jul 26, 2002
Sold by
Primacy Closing Corp
Bought by
Laferle Michael C and Laferle Amy T
Current Estimated Value
Home Financials for this Owner
Home Financials are based on the most recent Mortgage that was taken out on this home.
Original Mortgage
$290,000
Interest Rate
5.38%
Mortgage Type
New Conventional
Purchase Details
Closed on
Jun 5, 2000
Sold by
Carvalho Silva Fabio and Carvalho Silva Marll
Bought by
Trotti Joseph J and Trotti Lynne J
Home Financials for this Owner
Home Financials are based on the most recent Mortgage that was taken out on this home.
Original Mortgage
$400,000
Interest Rate
8.27%
Mortgage Type
New Conventional
Purchase Details
Closed on
Dec 18, 1995
Sold by
Intrex Corp
Bought by
Carvalho Silva Fabio
Create a Home Valuation Report for This Property
The Home Valuation Report is an in-depth analysis detailing your home's value as well as a comparison with similar homes in the area
Home Values in the Area
Average Home Value in this Area
Purchase History
| Date | Buyer | Sale Price | Title Company |
|---|---|---|---|
| Laferle Michael C | $650,000 | -- | |
| Trotti Joseph J | $585,000 | -- | |
| Carvalho Silva Fabio | $442,400 | -- |
Source: Public Records
Mortgage History
| Date | Status | Borrower | Loan Amount |
|---|---|---|---|
| Open | Laferle Michael C | $238,000 | |
| Closed | Laferle Michael C | $267,270 | |
| Closed | Laferle Michael C | $290,000 | |
| Previous Owner | Trotti Joseph J | $400,000 | |
| Closed | Carvalho Silva Fabio | $0 |
Source: Public Records
Tax History Compared to Growth
Tax History
| Year | Tax Paid | Tax Assessment Tax Assessment Total Assessment is a certain percentage of the fair market value that is determined by local assessors to be the total taxable value of land and additions on the property. | Land | Improvement |
|---|---|---|---|---|
| 2024 | $10,594 | $412,208 | $92,000 | $320,208 |
| 2023 | $9,935 | $406,864 | $74,000 | $332,864 |
| 2022 | $9,226 | $346,064 | $74,000 | $272,064 |
| 2021 | $8,676 | $320,940 | $74,000 | $246,940 |
| 2020 | $8,457 | $310,932 | $72,000 | $238,932 |
| 2019 | $8,457 | $310,932 | $72,000 | $238,932 |
| 2018 | $8,457 | $310,932 | $72,000 | $238,932 |
| 2017 | $8,119 | $310,932 | $72,000 | $238,932 |
| 2016 | $6,854 | $253,280 | $58,000 | $195,280 |
| 2015 | $7,018 | $253,280 | $58,000 | $195,280 |
| 2014 | $6,752 | $238,888 | $0 | $0 |
Source: Public Records
Map
Nearby Homes
- 2283 Edgemere Lake Cir
- 2250 Edgemere Lake Cir
- 2314 Edgemere Lake Cir
- 4047 Jordan Lake Dr
- 2321 Edgemere Lake Cir
- 4013 Chelsea Ln
- 2144 Lamplight Dr
- 4274 Revere Cir Unit 1C
- 4085 Chadds Walk
- 2122 Rockland Ct
- 4586 Smoke Rise Ln Unit 8B
- 2225 Johnson Ferry Rd
- 4065 Tritt Homestead Dr
- 3860 Bays Ferry Trail
- 4011 Charrwood Trace
- 2166 Carlyle Dr
- 3993 Amberley Ln
- 4004 Charrwood Trace
- 4331 Edgemere Dr Unit 1
- 4335 Edgemere Dr
- 2271 Edgemere Lake Cir Unit 1
- 0 Edgemere Dr Unit 7183409
- 0 Edgemere Dr Unit 8317826
- 0 Edgemere Dr Unit 8114849
- 0 Edgemere Dr Unit 8009021
- 0 Edgemere Dr Unit 7599764
- 0 Edgemere Dr Unit 8192360
- 0 Edgemere Dr Unit 8028888
- 0 Edgemere Dr Unit 8171493
- 0 Edgemere Dr Unit 8028898
- 0 Edgemere Dr Unit 7522571
- 0 Edgemere Dr Unit 7124725
- 0 Edgemere Dr Unit 7114194
- 0 Edgemere Dr
- 2275 Edgemere Lake Cir
- 4341 Edgemere Dr
- 2267 Edgemere Lake Cir Unit 1
- 4328 Edgemere Dr Unit 1