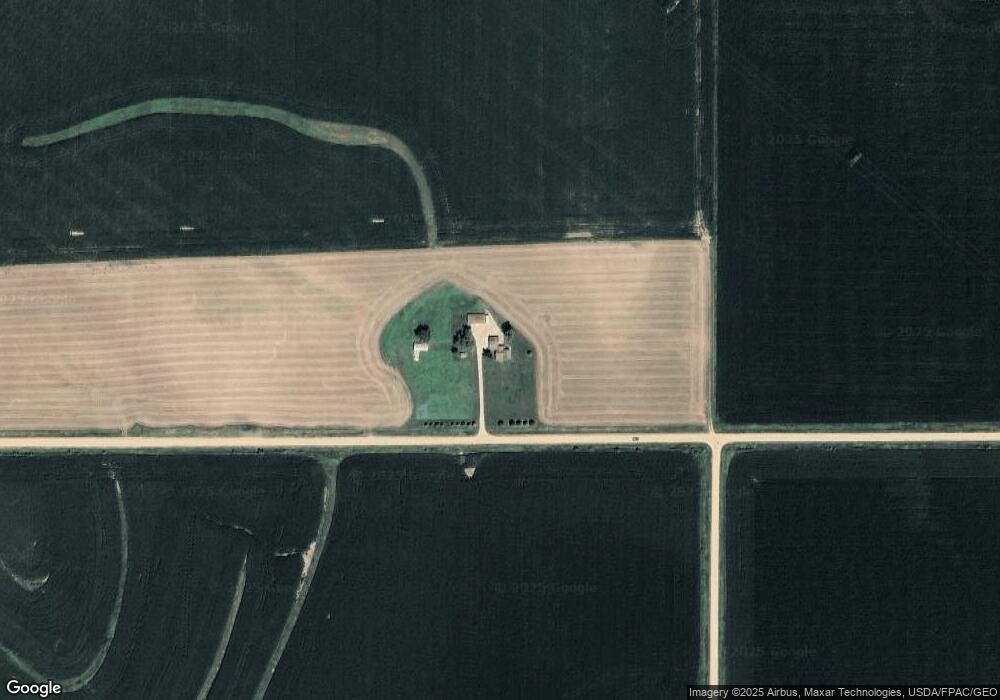
4337 330th St Danbury, IA 51019
Estimated Value: $111,000 - $185,000
--
Bed
--
Bath
1,463
Sq Ft
$105/Sq Ft
Est. Value
About This Home
This home is located at 4337 330th St, Danbury, IA 51019 and is currently estimated at $152,905, approximately $104 per square foot. 4337 330th St is a home located in Woodbury County with nearby schools including Mapleton Elementary School, Mvao Middle School, and Maple Valley-Anthon Oto High School.
Ownership History
Date
Name
Owned For
Owner Type
Purchase Details
Closed on
May 30, 2013
Sold by
The Estate Of Rebecca Seuntjens
Bought by
Seuntjens Dylan
Current Estimated Value
Home Financials for this Owner
Home Financials are based on the most recent Mortgage that was taken out on this home.
Original Mortgage
$55,360
Outstanding Balance
$39,052
Interest Rate
3.38%
Mortgage Type
New Conventional
Estimated Equity
$113,853
Purchase Details
Closed on
Dec 4, 2009
Sold by
Zingg Greg and Zingg Cindy
Bought by
Seuntjens Rebecca
Create a Home Valuation Report for This Property
The Home Valuation Report is an in-depth analysis detailing your home's value as well as a comparison with similar homes in the area
Home Values in the Area
Average Home Value in this Area
Purchase History
| Date | Buyer | Sale Price | Title Company |
|---|---|---|---|
| Seuntjens Dylan | $55,000 | None Available | |
| Seuntjens Rebecca | $65,000 | -- |
Source: Public Records
Mortgage History
| Date | Status | Borrower | Loan Amount |
|---|---|---|---|
| Open | Seuntjens Dylan | $55,360 |
Source: Public Records
Tax History Compared to Growth
Tax History
| Year | Tax Paid | Tax Assessment Tax Assessment Total Assessment is a certain percentage of the fair market value that is determined by local assessors to be the total taxable value of land and additions on the property. | Land | Improvement |
|---|---|---|---|---|
| 2025 | $992 | $129,020 | $50,400 | $78,620 |
| 2024 | $992 | $100,050 | $33,000 | $67,050 |
| 2023 | $1,018 | $100,050 | $33,000 | $67,050 |
| 2022 | $1,008 | $86,840 | $33,000 | $53,840 |
| 2021 | $1,008 | $86,840 | $33,000 | $53,840 |
| 2020 | $1,056 | $82,090 | $35,310 | $46,780 |
| 2019 | $922 | $82,090 | $35,310 | $46,780 |
| 2018 | $896 | $67,650 | $20,870 | $46,780 |
| 2017 | $896 | $67,650 | $20,870 | $46,780 |
| 2016 | $872 | $64,070 | $0 | $0 |
| 2015 | $815 | $59,870 | $19,500 | $40,370 |
| 2014 | $823 | $59,870 | $19,500 | $40,370 |
Source: Public Records
Map
Nearby Homes