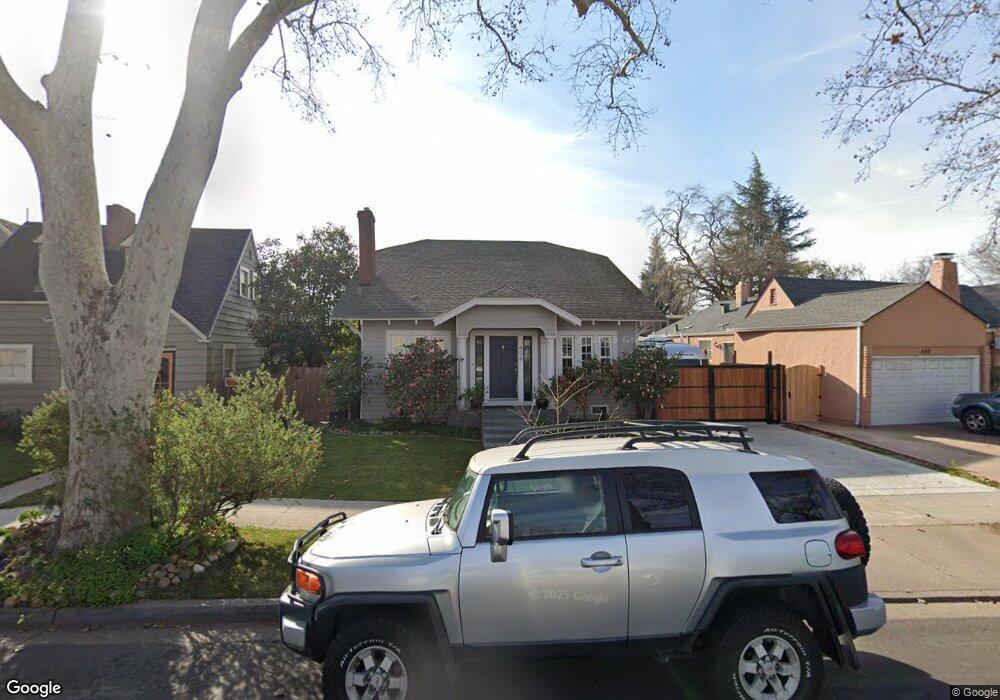
434 Bristol Ave Stockton, CA 95204
Midtown NeighborhoodEstimated Value: $358,000 - $545,000
4
Beds
2
Baths
2,032
Sq Ft
$238/Sq Ft
Est. Value
About This Home
This home is located at 434 Bristol Ave, Stockton, CA 95204 and is currently estimated at $483,955, approximately $238 per square foot. 434 Bristol Ave is a home located in San Joaquin County with nearby schools including Wilson Elementary School, El Dorado Elementary School, and Cleveland Elementary School.
Ownership History
Date
Name
Owned For
Owner Type
Purchase Details
Closed on
Sep 18, 2008
Sold by
Tenaza Laurie and Sherman Marcus
Bought by
Lapka Tabitha Lee and Knight John J
Current Estimated Value
Home Financials for this Owner
Home Financials are based on the most recent Mortgage that was taken out on this home.
Original Mortgage
$275,420
Outstanding Balance
$176,487
Interest Rate
5.77%
Mortgage Type
FHA
Estimated Equity
$307,468
Purchase Details
Closed on
Apr 13, 2001
Sold by
Mcquade Kathryn A and Tenaza Laurie
Bought by
Tenaza Laurie and Sherman Marcus
Home Financials for this Owner
Home Financials are based on the most recent Mortgage that was taken out on this home.
Original Mortgage
$125,000
Interest Rate
6.98%
Purchase Details
Closed on
Feb 20, 2001
Sold by
Mcquade Kathryn A
Bought by
Tenaza Laurie B and Sherman Marcus E
Home Financials for this Owner
Home Financials are based on the most recent Mortgage that was taken out on this home.
Original Mortgage
$125,000
Interest Rate
6.98%
Create a Home Valuation Report for This Property
The Home Valuation Report is an in-depth analysis detailing your home's value as well as a comparison with similar homes in the area
Home Values in the Area
Average Home Value in this Area
Purchase History
| Date | Buyer | Sale Price | Title Company |
|---|---|---|---|
| Lapka Tabitha Lee | $336,500 | Old Republic Title Company | |
| Tenaza Laurie | -- | Old Republic Title Company | |
| Tenaza Laurie B | -- | -- |
Source: Public Records
Mortgage History
| Date | Status | Borrower | Loan Amount |
|---|---|---|---|
| Open | Lapka Tabitha Lee | $275,420 | |
| Previous Owner | Tenaza Laurie | $125,000 |
Source: Public Records
Tax History Compared to Growth
Tax History
| Year | Tax Paid | Tax Assessment Tax Assessment Total Assessment is a certain percentage of the fair market value that is determined by local assessors to be the total taxable value of land and additions on the property. | Land | Improvement |
|---|---|---|---|---|
| 2025 | $4,886 | $396,609 | $96,575 | $300,034 |
| 2024 | $4,809 | $388,833 | $94,682 | $294,151 |
| 2023 | $4,702 | $381,210 | $92,826 | $288,384 |
| 2022 | $4,642 | $373,736 | $91,006 | $282,730 |
| 2021 | $4,460 | $366,409 | $89,222 | $277,187 |
| 2020 | $4,548 | $362,653 | $88,308 | $274,345 |
| 2019 | $4,531 | $355,543 | $86,577 | $268,966 |
| 2018 | $4,447 | $348,573 | $84,880 | $263,693 |
| 2017 | $4,211 | $341,739 | $83,216 | $258,523 |
| 2016 | $4,290 | $335,039 | $81,584 | $253,455 |
| 2014 | $3,334 | $264,000 | $79,000 | $185,000 |
Source: Public Records
Map
Nearby Homes
- 423 W Monterey Ave
- 635 N Regent St
- 110 W Monterey Ave
- 145 W Mendocino Ave
- 409 S Central Ave
- 822 W Mariposa Ave
- 520 W Alpine Ave
- 674 N Tuxedo Ave
- 2820 N El Dorado St
- 2625 Westminister Ave
- 960 Bristol Ave
- 844 W Euclid Ave
- 815 W Euclid Ave
- 129 E Sonoma Ave
- 144 E Sonoma Ave
- 1030 Elmwood Ave
- 1060 W Monterey Ave
- 1019 S Country Club Blvd
- 1520 N Commerce St
- 1071 W Monterey Ave
- 442 Bristol Ave
- 424 Bristol Ave
- 411 N Regent St
- 450 Bristol Ave
- 333 Regent Ct
- 420 Bristol Ave
- 421 N Regent St
- 421 N Regent St
- 460 Bristol Ave
- 321 Regent Ct
- 429 N Regent St
- 431 Bristol Ave
- 466 Bristol Ave
- 309 Regent Ct
- 439 Bristol Ave
- 437 N Regent St
- 447 Bristol Ave
- 418 Smith Ln
- 474 Bristol Ave
- 412 N Regent St