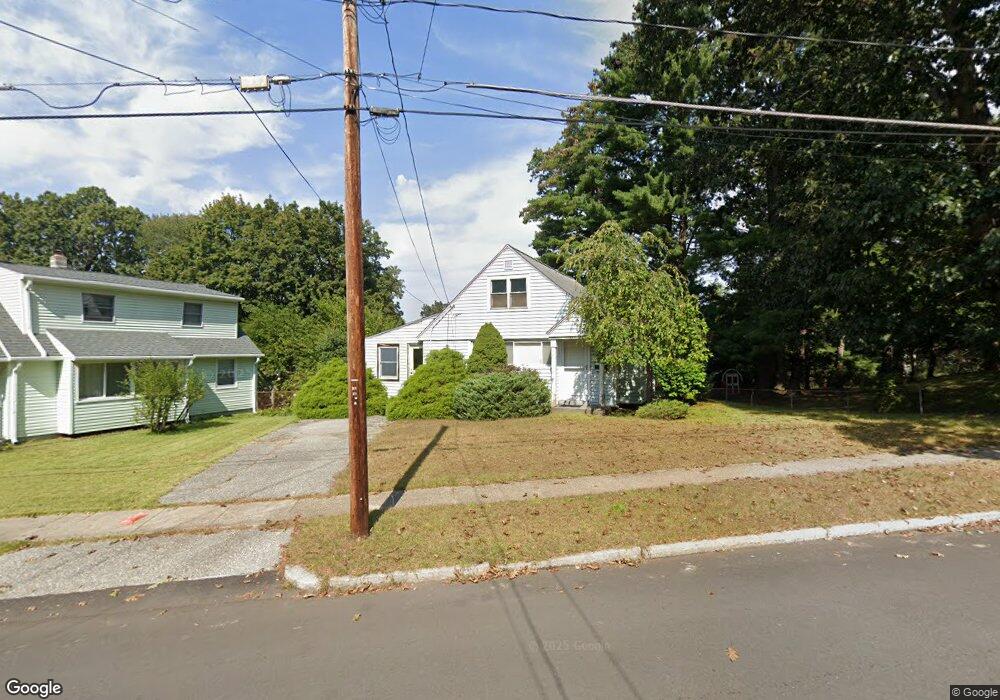
434 Gifford St Springfield, MA 01118
East Forest Park NeighborhoodEstimated Value: $262,000 - $299,000
3
Beds
1
Bath
1,163
Sq Ft
$246/Sq Ft
Est. Value
About This Home
This home is located at 434 Gifford St, Springfield, MA 01118 and is currently estimated at $286,454, approximately $246 per square foot. 434 Gifford St is a home located in Hampden County with nearby schools including Frederick Harris Elementary School, M Marcus Kiley Middle, and Springfield High School of Science and Technology.
Ownership History
Date
Name
Owned For
Owner Type
Purchase Details
Closed on
Nov 19, 1992
Sold by
Plaus Harley O
Bought by
Plaus Gary A
Current Estimated Value
Home Financials for this Owner
Home Financials are based on the most recent Mortgage that was taken out on this home.
Original Mortgage
$40,000
Interest Rate
7.95%
Mortgage Type
Purchase Money Mortgage
Create a Home Valuation Report for This Property
The Home Valuation Report is an in-depth analysis detailing your home's value as well as a comparison with similar homes in the area
Home Values in the Area
Average Home Value in this Area
Purchase History
| Date | Buyer | Sale Price | Title Company |
|---|---|---|---|
| Plaus Gary A | $65,000 | -- |
Source: Public Records
Mortgage History
| Date | Status | Borrower | Loan Amount |
|---|---|---|---|
| Closed | Plaus Gary A | $15,000 | |
| Closed | Plaus Gary A | $40,000 |
Source: Public Records
Tax History Compared to Growth
Tax History
| Year | Tax Paid | Tax Assessment Tax Assessment Total Assessment is a certain percentage of the fair market value that is determined by local assessors to be the total taxable value of land and additions on the property. | Land | Improvement |
|---|---|---|---|---|
| 2025 | $3,845 | $245,200 | $48,000 | $197,200 |
| 2024 | $3,538 | $220,300 | $48,000 | $172,300 |
| 2023 | $3,453 | $202,500 | $45,700 | $156,800 |
| 2022 | $3,376 | $179,400 | $45,700 | $133,700 |
| 2021 | $2,773 | $146,700 | $41,500 | $105,200 |
| 2020 | $2,746 | $140,600 | $41,500 | $99,100 |
| 2019 | $2,692 | $136,800 | $41,500 | $95,300 |
| 2018 | $2,775 | $141,000 | $41,500 | $99,500 |
| 2017 | $2,638 | $134,200 | $41,500 | $92,700 |
| 2016 | $2,564 | $130,400 | $41,500 | $88,900 |
| 2015 | $2,473 | $125,700 | $41,500 | $84,200 |
Source: Public Records
Map
Nearby Homes
- 125 Manor Ct Unit 125
- 392 Gifford St
- 157 Canterbury Rd
- 19 Manor Ct Unit 19
- 5 Manor Ct Unit 5
- 77 W Allen Ridge Rd
- 43 Sunridge Dr
- 206 Treetop Ave
- 56 Hadley St
- 26 Harkness Ave
- 55 Allen St
- 54 Shady Brook Ln
- 155 Powell Ave
- 261 W Allen Ridge Rd
- 17 Pebble Mill Rd
- 196 Sawmill Rd
- 95 Benz St
- 36 Garland St
- 100 Abbott St
- 101 Regal St
- 446 Gifford St
- 428 Gifford St
- 420 Gifford St
- 118 Manor Ct
- 116 Manor Ct Unit 116
- 120 Manor Ct Unit 120
- 165 Manor Ct Unit 165
- 157 Manor Ct Unit 157
- 161 Manor Ct Unit 161
- 91 Canterbury Rd
- 433 Gifford St
- 439 Gifford St
- 85 Canterbury Rd
- 427 Gifford St
- 97 Canterbury Rd
- 1042 Manor Ct Unit B
- 1078 Manor Ct Unit D
- 1042D Manor Ct
- 445 Gifford St
- 421 Gifford St