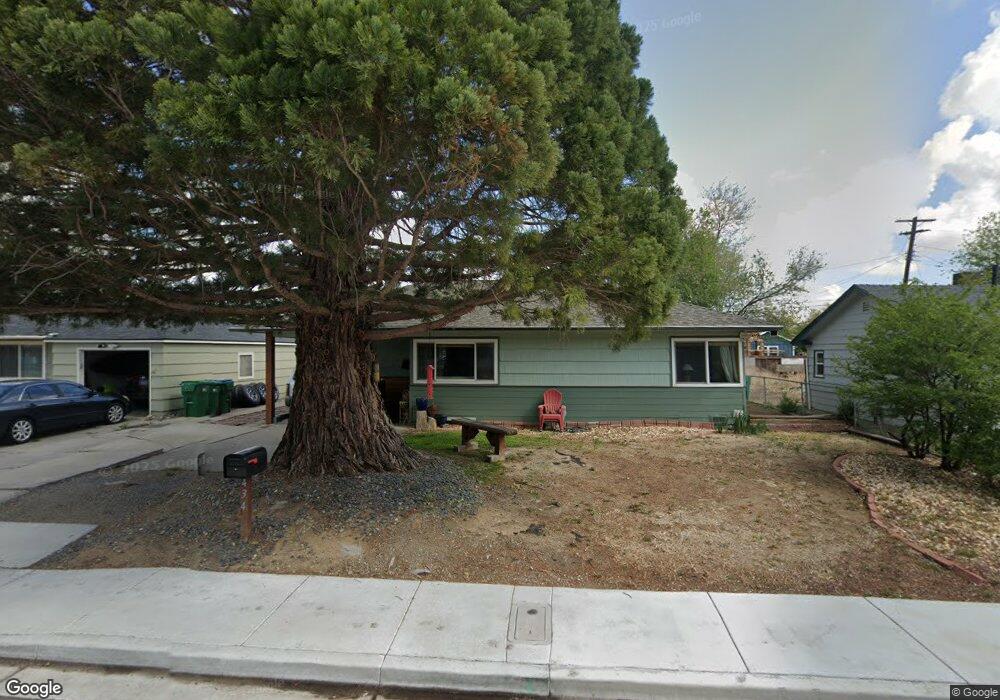
434 H St Sparks, NV 89431
Downtown Sparks NeighborhoodEstimated Value: $331,000 - $366,000
2
Beds
1
Bath
960
Sq Ft
$366/Sq Ft
Est. Value
About This Home
This home is located at 434 H St, Sparks, NV 89431 and is currently estimated at $351,631, approximately $366 per square foot. 434 H St is a home located in Washoe County with nearby schools including Greenbrae Elementary School, George L Dilworth Middle School, and Sparks High School.
Ownership History
Date
Name
Owned For
Owner Type
Purchase Details
Closed on
Sep 29, 2009
Sold by
Rosso Damela
Bought by
Rosso Damela
Current Estimated Value
Purchase Details
Closed on
Mar 18, 1998
Sold by
Horst Karl
Bought by
Rasico Daniela
Home Financials for this Owner
Home Financials are based on the most recent Mortgage that was taken out on this home.
Original Mortgage
$78,000
Outstanding Balance
$14,269
Interest Rate
7.02%
Estimated Equity
$337,362
Create a Home Valuation Report for This Property
The Home Valuation Report is an in-depth analysis detailing your home's value as well as a comparison with similar homes in the area
Home Values in the Area
Average Home Value in this Area
Purchase History
| Date | Buyer | Sale Price | Title Company |
|---|---|---|---|
| Rosso Damela | -- | None Available | |
| Rasico Daniela | $93,000 | Western Title Company Inc |
Source: Public Records
Mortgage History
| Date | Status | Borrower | Loan Amount |
|---|---|---|---|
| Open | Rasico Daniela | $78,000 |
Source: Public Records
Tax History Compared to Growth
Tax History
| Year | Tax Paid | Tax Assessment Tax Assessment Total Assessment is a certain percentage of the fair market value that is determined by local assessors to be the total taxable value of land and additions on the property. | Land | Improvement |
|---|---|---|---|---|
| 2025 | $609 | $47,739 | $33,565 | $14,174 |
| 2024 | $609 | $44,054 | $30,065 | $13,990 |
| 2023 | $594 | $44,199 | $31,325 | $12,874 |
| 2022 | $576 | $36,689 | $26,180 | $10,509 |
| 2021 | $560 | $28,177 | $17,955 | $10,222 |
| 2020 | $542 | $26,990 | $16,940 | $10,050 |
| 2019 | $529 | $25,426 | $15,890 | $9,536 |
| 2018 | $512 | $20,862 | $11,725 | $9,137 |
| 2017 | $496 | $19,389 | $10,395 | $8,994 |
| 2016 | $485 | $18,327 | $9,345 | $8,982 |
| 2015 | $128 | $16,562 | $7,700 | $8,862 |
| 2014 | $467 | $14,805 | $6,440 | $8,365 |
| 2013 | -- | $12,427 | $4,270 | $8,157 |
Source: Public Records
Map
Nearby Homes