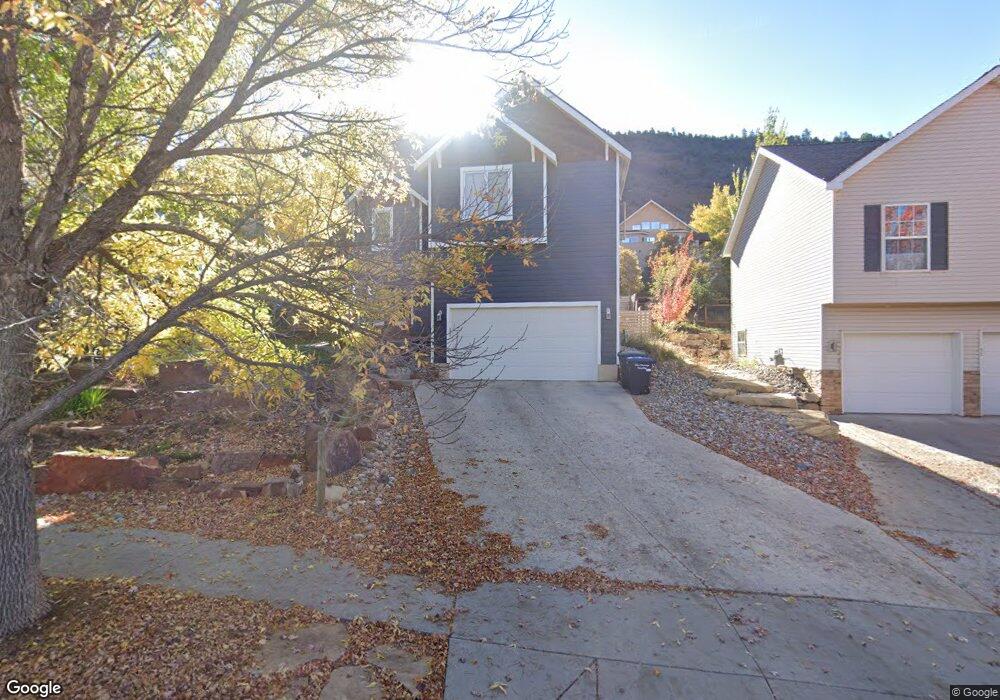
434 Jenkins Ranch Rd Durango, CO 81301
Skyridge NeighborhoodEstimated Value: $840,000 - $981,000
3
Beds
3
Baths
2,152
Sq Ft
$415/Sq Ft
Est. Value
About This Home
This home is located at 434 Jenkins Ranch Rd, Durango, CO 81301 and is currently estimated at $892,581, approximately $414 per square foot. 434 Jenkins Ranch Rd is a home located in La Plata County with nearby schools including Park Elementary School, Escalante Middle School, and Durango High School.
Ownership History
Date
Name
Owned For
Owner Type
Purchase Details
Closed on
Dec 30, 2015
Sold by
James Peter and Jensen Cheree Lynn
Bought by
Aeby Katherine M
Current Estimated Value
Purchase Details
Closed on
Mar 18, 2005
Sold by
Shepherd David E and Shepherd Lora L
Bought by
Jenesen James Peter and Jensen Cheree Lynn
Home Financials for this Owner
Home Financials are based on the most recent Mortgage that was taken out on this home.
Original Mortgage
$280,000
Interest Rate
5.37%
Mortgage Type
Adjustable Rate Mortgage/ARM
Purchase Details
Closed on
Nov 1, 2001
Bought by
Aeby Katherine M
Create a Home Valuation Report for This Property
The Home Valuation Report is an in-depth analysis detailing your home's value as well as a comparison with similar homes in the area
Home Values in the Area
Average Home Value in this Area
Purchase History
| Date | Buyer | Sale Price | Title Company |
|---|---|---|---|
| Aeby Katherine M | $433,750 | Land Title | |
| Jenesen James Peter | $350,000 | Land Title | |
| Aeby Katherine M | $58,000 | -- |
Source: Public Records
Mortgage History
| Date | Status | Borrower | Loan Amount |
|---|---|---|---|
| Previous Owner | Jenesen James Peter | $280,000 |
Source: Public Records
Tax History Compared to Growth
Tax History
| Year | Tax Paid | Tax Assessment Tax Assessment Total Assessment is a certain percentage of the fair market value that is determined by local assessors to be the total taxable value of land and additions on the property. | Land | Improvement |
|---|---|---|---|---|
| 2025 | $1,747 | $46,560 | $12,310 | $34,250 |
| 2024 | $1,747 | $46,560 | $12,310 | $34,250 |
| 2023 | $1,486 | $40,040 | $12,040 | $28,000 |
| 2022 | $1,351 | $42,180 | $12,680 | $29,500 |
| 2021 | $1,357 | $34,190 | $9,380 | $24,810 |
| 2020 | $1,315 | $34,210 | $9,290 | $24,920 |
| 2019 | $1,258 | $34,210 | $9,290 | $24,920 |
| 2018 | $1,181 | $32,510 | $8,790 | $23,720 |
| 2017 | $1,155 | $32,510 | $8,790 | $23,720 |
| 2016 | $1,076 | $33,010 | $8,570 | $24,440 |
| 2015 | $1,008 | $33,010 | $8,570 | $24,440 |
| 2014 | -- | $29,070 | $8,570 | $20,500 |
| 2013 | -- | $29,070 | $8,570 | $20,500 |
Source: Public Records
Map
Nearby Homes
- 9 Sage Hill Ct
- 4678 County Road 240
- 1200 Florida Rd Unit 7
- 1100 Goeglein Gulch Rd Unit 155
- 1100 Goeglein Gulch Rd Unit 225
- 1100 Goeglein Gulch Rd Unit 233
- 2801 Elm Place
- 1135 Florida Rd Unit 27
- 1135 Florida Rd Unit 4
- 900 Florida Rd
- 1720 Florida Rd
- 2920 Holly Ave Unit 104
- 170 Metz Ln
- 349 Highland Hill Dr
- 125 Ball Ln
- 220 Metz Ln Unit 601
- 180 Metz Ln Unit 1302
- 6 Ferringway Cir Unit 22
- 6 Ferringway Cir Unit 18
- 175 Metz Ln Unit 304
- 436 Jenkins Ranch Rd
- 432 Jenkins Ranch Rd
- 430 Jenkins Ranch Rd
- 438 Jenkins Ranch Rd
- 17 Lizardhead Dr
- 15 Lizardhead Dr
- 19 Lizardhead Dr
- 13 Lizardhead Dr
- 428 Jenkins Ranch Rd
- 440 Jenkins Ranch Rd
- 21 Lizardhead Dr
- 11 Lizardhead Dr
- 11 Lizardhead Dr Unit Skyridge
- 0 Lizard Head Dr Unit 768118
- 0 Lizard Head Dr Unit 761394
- 0 Lizard Head Dr Unit 761327
- 0 Lizard Head Dr Unit 754707
- 0 Lizard Head Dr Unit 749125
- 0 Lizard Head Dr Unit 748046
- 0 Lizard Head Dr Unit 743437