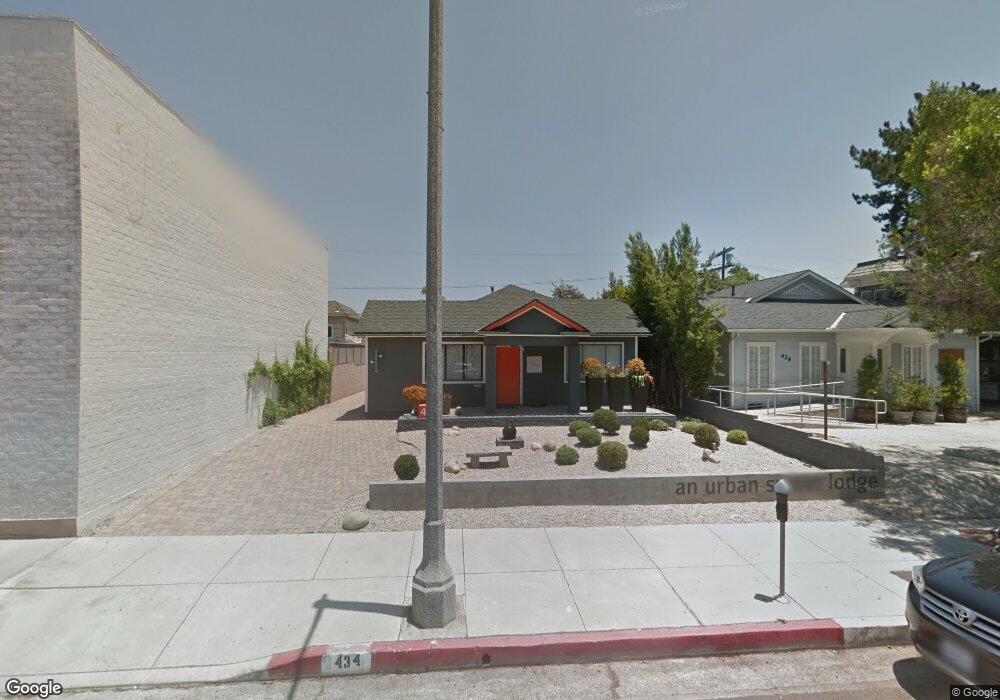
434 N Larchmont Blvd Los Angeles, CA 90004
Larchmont NeighborhoodEstimated Value: $2,030,260
--
Bed
--
Bath
1,288
Sq Ft
$1,576/Sq Ft
Est. Value
About This Home
This home is located at 434 N Larchmont Blvd, Los Angeles, CA 90004 and is currently estimated at $2,030,260, approximately $1,576 per square foot. 434 N Larchmont Blvd is a home located in Los Angeles County with nearby schools including Van Ness Avenue Elementary School, Hubert Howe Bancroft Middle School, and Fairfax High School.
Ownership History
Date
Name
Owned For
Owner Type
Purchase Details
Closed on
Jan 23, 2025
Sold by
Zashchita Llc
Bought by
444 Larchmont Llc
Current Estimated Value
Home Financials for this Owner
Home Financials are based on the most recent Mortgage that was taken out on this home.
Original Mortgage
$1,329,250
Outstanding Balance
$1,320,422
Interest Rate
7.04%
Mortgage Type
New Conventional
Estimated Equity
$709,838
Purchase Details
Closed on
Dec 4, 2009
Sold by
Foster Rosa Leong
Bought by
Lester Larry and Lester Irma
Purchase Details
Closed on
May 15, 2006
Sold by
Leong Rosa
Bought by
Foster Rosa Leong and Foster Gerald Leon
Purchase Details
Closed on
Aug 18, 1997
Sold by
Evans Marylynn I
Bought by
Leong Rosa and Foster Gerald L
Home Financials for this Owner
Home Financials are based on the most recent Mortgage that was taken out on this home.
Original Mortgage
$299,000
Interest Rate
7.43%
Mortgage Type
Commercial
Create a Home Valuation Report for This Property
The Home Valuation Report is an in-depth analysis detailing your home's value as well as a comparison with similar homes in the area
Home Values in the Area
Average Home Value in this Area
Purchase History
| Date | Buyer | Sale Price | Title Company |
|---|---|---|---|
| 444 Larchmont Llc | $2,045,000 | Wfg National Title | |
| Zashchita Llc | -- | Wfg National Title | |
| Lester Kathy T | -- | Wfg National Title | |
| Lester Larry | $900,000 | North American Title Company | |
| Foster Rosa Leong | -- | None Available | |
| Leong Rosa | $370,000 | -- |
Source: Public Records
Mortgage History
| Date | Status | Borrower | Loan Amount |
|---|---|---|---|
| Open | 444 Larchmont Llc | $1,329,250 | |
| Previous Owner | Leong Rosa | $299,000 |
Source: Public Records
Tax History Compared to Growth
Tax History
| Year | Tax Paid | Tax Assessment Tax Assessment Total Assessment is a certain percentage of the fair market value that is determined by local assessors to be the total taxable value of land and additions on the property. | Land | Improvement |
|---|---|---|---|---|
| 2025 | $14,187 | $1,167,328 | $753,457 | $413,871 |
| 2024 | $14,187 | $1,144,440 | $738,684 | $405,756 |
| 2023 | $13,918 | $1,122,000 | $724,200 | $397,800 |
| 2022 | $13,219 | $1,094,725 | $912,275 | $182,450 |
| 2021 | $13,060 | $1,073,261 | $894,388 | $178,873 |
| 2019 | $12,675 | $1,041,429 | $867,861 | $173,568 |
| 2018 | $12,536 | $1,021,010 | $850,845 | $170,165 |
| 2016 | $12,002 | $981,364 | $817,806 | $163,558 |
| 2015 | $11,828 | $966,624 | $805,522 | $161,102 |
| 2014 | $11,867 | $947,690 | $789,743 | $157,947 |
Source: Public Records
Map
Nearby Homes
- 434 N Beachwood Dr
- 507 N Lucerne Blvd
- 408 N Beachwood Dr
- 536 N Arden Blvd
- 326 N Gower St
- 424 N Arden Blvd
- 584 N Plymouth Blvd
- 565 N Arden Blvd
- 532 N Rossmore Ave Unit 406
- 532 N Rossmore Ave Unit 411
- 532 N Rossmore Ave Unit 107
- 585 N Rossmore Ave Unit 409
- 585 N Rossmore Ave Unit 407
- 516 N Bronson Ave
- 441 N Norton Ave
- 253 N Irving Blvd
- 5725 Melrose Ave
- 312 N Bronson Ave
- 5021 Elmwood Ave
- 362 N Norton Ave
- 424 N Larchmont Blvd
- 435 N Gower St
- 439 N Gower St
- 429 N Gower St
- 425 N Gower St
- 445 N Gower St
- 419 N Gower St
- 435 N Larchmont Blvd
- 429 N Larchmont Blvd
- 415 N Gower St
- 500 N Larchmont Blvd
- 501 N Gower St Unit ADU
- 501 N Gower St
- 503 N Gower St Unit ADU
- 434 N Gower St
- 409 N Gower St
- 438 N Gower St
- 428 N Gower St
- 507 N Gower St
- 424 N Gower St