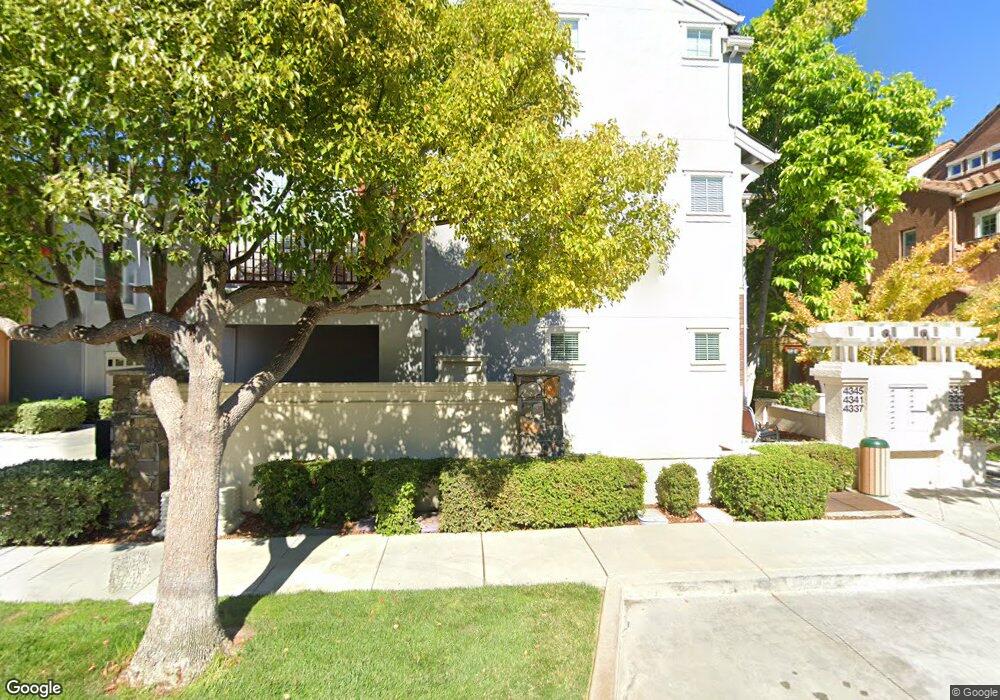
4341 Watson Cir Santa Clara, CA 95054
North Santa Clara NeighborhoodEstimated Value: $1,741,338 - $1,848,000
3
Beds
3
Baths
1,590
Sq Ft
$1,141/Sq Ft
Est. Value
About This Home
This home is located at 4341 Watson Cir, Santa Clara, CA 95054 and is currently estimated at $1,814,835, approximately $1,141 per square foot. 4341 Watson Cir is a home located in Santa Clara County with nearby schools including Don Callejon School, Santa Clara High School, and North Valley Baptist School.
Ownership History
Date
Name
Owned For
Owner Type
Purchase Details
Closed on
Jul 12, 2007
Sold by
Obico Peter and Obico Amber Scarlett
Bought by
Hu Jianguo and Gan Qiuhong
Current Estimated Value
Home Financials for this Owner
Home Financials are based on the most recent Mortgage that was taken out on this home.
Original Mortgage
$660,800
Outstanding Balance
$402,114
Interest Rate
6%
Mortgage Type
Purchase Money Mortgage
Estimated Equity
$1,412,721
Purchase Details
Closed on
Apr 22, 2004
Sold by
Greystone Homes Inc
Bought by
Obico Peter and Scarlett Amber
Home Financials for this Owner
Home Financials are based on the most recent Mortgage that was taken out on this home.
Original Mortgage
$512,565
Interest Rate
4.25%
Mortgage Type
Purchase Money Mortgage
Create a Home Valuation Report for This Property
The Home Valuation Report is an in-depth analysis detailing your home's value as well as a comparison with similar homes in the area
Home Values in the Area
Average Home Value in this Area
Purchase History
| Date | Buyer | Sale Price | Title Company |
|---|---|---|---|
| Hu Jianguo | $826,000 | Alliance Title Company | |
| Obico Peter | $641,000 | North American Title Company |
Source: Public Records
Mortgage History
| Date | Status | Borrower | Loan Amount |
|---|---|---|---|
| Open | Hu Jianguo | $660,800 | |
| Previous Owner | Obico Peter | $512,565 | |
| Closed | Obico Peter | $96,106 |
Source: Public Records
Tax History Compared to Growth
Tax History
| Year | Tax Paid | Tax Assessment Tax Assessment Total Assessment is a certain percentage of the fair market value that is determined by local assessors to be the total taxable value of land and additions on the property. | Land | Improvement |
|---|---|---|---|---|
| 2025 | $12,415 | $1,084,952 | $650,974 | $433,978 |
| 2024 | $12,415 | $1,063,679 | $638,210 | $425,469 |
| 2023 | $12,289 | $1,042,824 | $625,697 | $417,127 |
| 2022 | $12,089 | $1,022,378 | $613,429 | $408,949 |
| 2021 | $12,041 | $1,002,332 | $601,401 | $400,931 |
| 2020 | $11,821 | $992,055 | $595,235 | $396,820 |
| 2019 | $11,805 | $972,604 | $583,564 | $389,040 |
| 2018 | $11,045 | $953,534 | $572,122 | $381,412 |
| 2017 | $10,989 | $934,838 | $560,904 | $373,934 |
| 2016 | $10,743 | $916,508 | $549,906 | $366,602 |
| 2015 | $10,701 | $902,742 | $541,646 | $361,096 |
| 2014 | $10,173 | $885,059 | $531,036 | $354,023 |
Source: Public Records
Map
Nearby Homes
- 1220 Kelley Way
- 4226 Tobin Cir
- 3901 Lick Mill Blvd Unit 230
- 3901 Lick Mill Blvd Unit 458
- 1898 Garzoni Place
- 1901 Garzoni Place Unit 405
- 1883 Agnew Rd Unit 341
- 1883 Agnew Rd Unit 367
- 4636 Armour Dr
- 920 Clyde Ave
- 930 Clyde Ave
- 4288 Macedo Place
- 4699 Snead Dr
- 1031 Clyde Ave Unit 1802
- 4676 Wilcox Ave
- 4503 Cheeney St
- 250 El Bosque Dr Unit 250
- 1900 Chestnut St
- 241 Montague Expy
- 247 Montague Expy
- 4345 Watson Cir
- 4353 Watson Cir
- 4329 Watson Cir
- 4357 Watson Cir
- 4333 Watson Cir
- 4349 Watson Cir
- 4325 Watson Cir
- 4344 Watson Cir
- 4338 Watson Cir
- 4365 Watson Cir
- 4317 Watson Cir
- 4361 Watson Cir
- 4313 Watson Cir
- 4369 Watson Cir
- 4321 Watson Cir
- 4348 Watson Cir
- 4364 Watson Cir
- 4316 Watson Cir
- 4334 Watson Cir
- 4320 Watson Cir