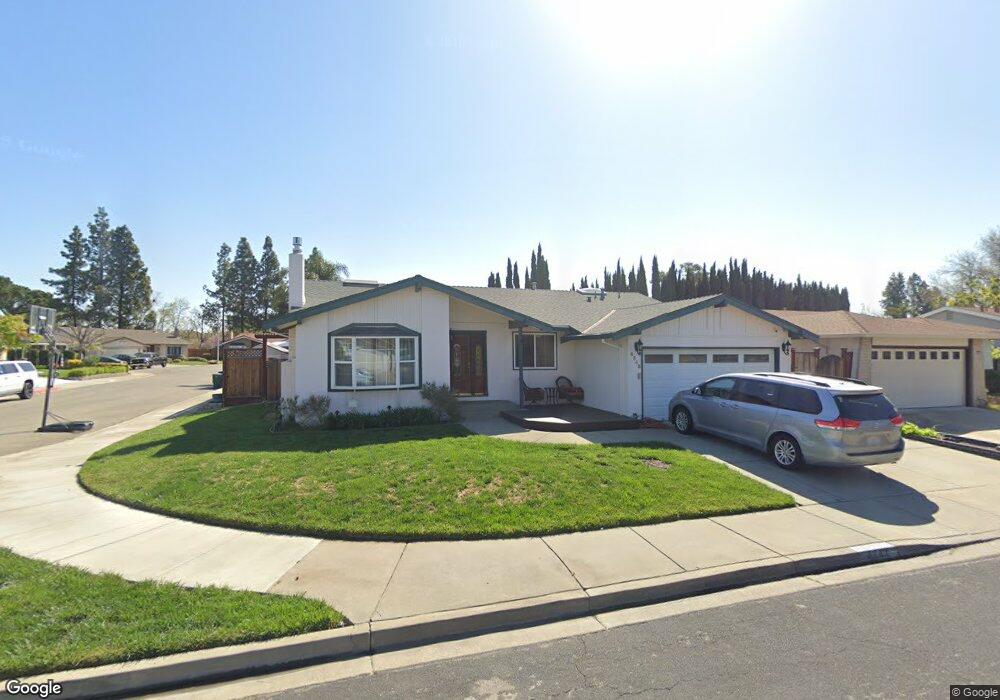
4343 Addison Way Pleasanton, CA 94588
Stoneridge NeighborhoodEstimated Value: $1,389,000 - $1,535,000
4
Beds
2
Baths
1,816
Sq Ft
$810/Sq Ft
Est. Value
About This Home
This home is located at 4343 Addison Way, Pleasanton, CA 94588 and is currently estimated at $1,471,596, approximately $810 per square foot. 4343 Addison Way is a home located in Alameda County with nearby schools including Donlon Elementary School, Thomas S. Hart Middle School, and Foothill High School.
Ownership History
Date
Name
Owned For
Owner Type
Purchase Details
Closed on
May 25, 2012
Sold by
Kinsey Scott L and Kinsey Karen L
Bought by
Kinsey Scott L and Kinsey Karen L
Current Estimated Value
Purchase Details
Closed on
Aug 19, 1999
Sold by
Schumacher Shirley A and Johnston Steven F
Bought by
Kinsey Scott L and Kinsey Karen L
Home Financials for this Owner
Home Financials are based on the most recent Mortgage that was taken out on this home.
Original Mortgage
$272,000
Outstanding Balance
$77,614
Interest Rate
7.56%
Estimated Equity
$1,393,982
Purchase Details
Closed on
May 2, 1995
Sold by
Vanfleet Richard K and Vanfleet Barbara
Bought by
Schumacher Steven F S and Schumacher Shirley A J
Home Financials for this Owner
Home Financials are based on the most recent Mortgage that was taken out on this home.
Original Mortgage
$206,600
Interest Rate
7.25%
Create a Home Valuation Report for This Property
The Home Valuation Report is an in-depth analysis detailing your home's value as well as a comparison with similar homes in the area
Home Values in the Area
Average Home Value in this Area
Purchase History
| Date | Buyer | Sale Price | Title Company |
|---|---|---|---|
| Kinsey Scott L | -- | None Available | |
| Kinsey Scott L | -- | None Available | |
| Kinsey Scott L | $352,500 | First California Title Compa | |
| Schumacher Steven F S | $217,500 | Chicago Title Company |
Source: Public Records
Mortgage History
| Date | Status | Borrower | Loan Amount |
|---|---|---|---|
| Open | Kinsey Scott L | $272,000 | |
| Previous Owner | Schumacher Steven F S | $206,600 |
Source: Public Records
Tax History Compared to Growth
Tax History
| Year | Tax Paid | Tax Assessment Tax Assessment Total Assessment is a certain percentage of the fair market value that is determined by local assessors to be the total taxable value of land and additions on the property. | Land | Improvement |
|---|---|---|---|---|
| 2025 | $6,218 | $534,292 | $162,449 | $378,843 |
| 2024 | $6,218 | $523,680 | $159,264 | $371,416 |
| 2023 | $6,145 | $520,276 | $156,142 | $364,134 |
| 2022 | $5,822 | $503,077 | $153,081 | $356,996 |
| 2021 | $5,671 | $493,077 | $150,080 | $349,997 |
| 2020 | $5,598 | $494,953 | $148,542 | $346,411 |
| 2019 | $5,664 | $485,250 | $145,630 | $339,620 |
| 2018 | $5,549 | $475,737 | $142,775 | $332,962 |
| 2017 | $5,406 | $466,411 | $139,976 | $326,435 |
| 2016 | $4,988 | $457,267 | $137,232 | $320,035 |
| 2015 | $4,894 | $450,400 | $135,171 | $315,229 |
| 2014 | $4,980 | $441,577 | $132,523 | $309,054 |
Source: Public Records
Map
Nearby Homes
- 6137 Inglewood Dr
- 6289 Garner Ct
- 6342 Alvord Way
- 4205 Dorman Rd
- 6852 Massey Ct
- 6355 Singletree Way
- 3530 Carlsbad Ct
- 3702 Gettysburg Ct N
- 4165 Cortina Ct
- 4421 Muirwood Dr
- 4052 Ghiotti Ct
- 4504 Muirwood Dr
- 4068 Ghiotti Ct
- 4251 Lucero Ct
- 5740 Belleza Dr
- 4336 Muirwood Dr
- 2589 Larrikeet Ct
- 7606 Desertwood Ln
- 5988 Corte Cerritos
- 3636 Shenandoah Ct
- 4325 Addison Way
- 6072 Audrey Ct
- 4361 Addison Way
- 4307 Addison Way
- 6067 Inglewood Dr
- 6075 Audrey Ct
- 6050 Audrey Ct
- 4346 Addison Way
- 4354 Addison Way
- 4328 Addison Way
- 4379 Addison Way
- 6045 Inglewood Dr
- 4366 Addison Way
- 6053 Audrey Ct
- 6023 Inglewood Dr
- 4382 Addison Way
- 6074 Ashley Ct
- 4395 Addison Way
- 6028 Audrey Ct
- 4435 Bacon Ct