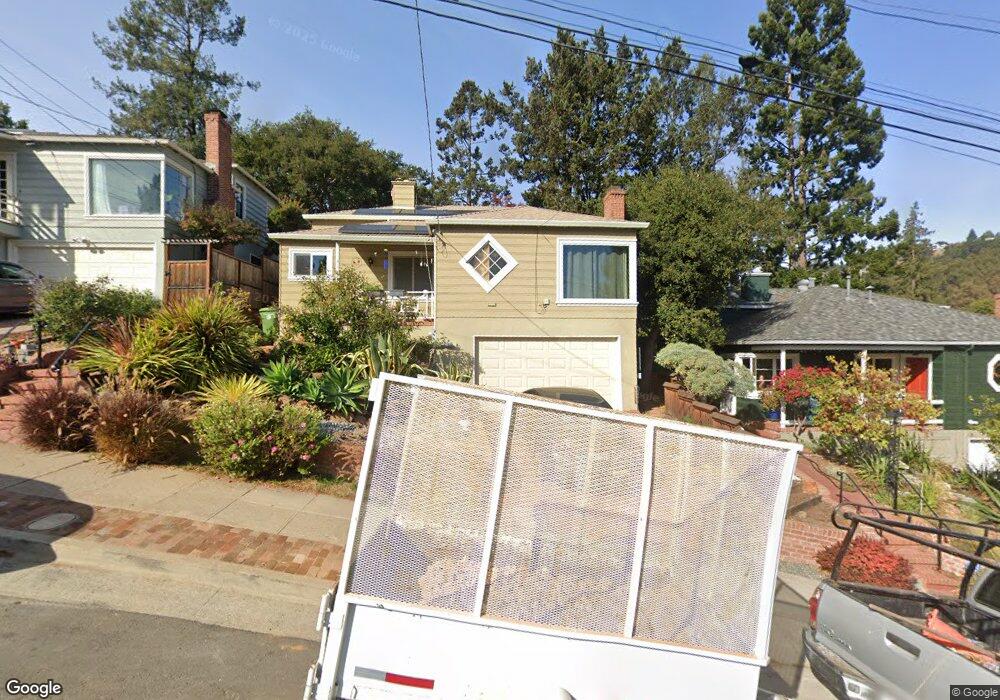
4343 Anderson Ave Oakland, CA 94619
Redwood Heights NeighborhoodEstimated Value: $879,709 - $1,009,000
3
Beds
2
Baths
1,268
Sq Ft
$751/Sq Ft
Est. Value
About This Home
This home is located at 4343 Anderson Ave, Oakland, CA 94619 and is currently estimated at $952,177, approximately $750 per square foot. 4343 Anderson Ave is a home located in Alameda County with nearby schools including Redwood Heights Elementary School, Bret Harte Middle School, and Skyline High School.
Ownership History
Date
Name
Owned For
Owner Type
Purchase Details
Closed on
Feb 9, 2021
Sold by
Davis Richard L
Bought by
Davis Richard L and The Richard L Davis Living Tru
Current Estimated Value
Purchase Details
Closed on
Sep 16, 2019
Sold by
Davis Richard L and Godfrey Myriam B
Bought by
Davis Richard L
Home Financials for this Owner
Home Financials are based on the most recent Mortgage that was taken out on this home.
Original Mortgage
$426,000
Interest Rate
3.4%
Mortgage Type
New Conventional
Purchase Details
Closed on
Aug 14, 1997
Sold by
Sommer Gary L and Sommer Susan A
Bought by
Davis Richard L and Godfrey Myriam B
Home Financials for this Owner
Home Financials are based on the most recent Mortgage that was taken out on this home.
Original Mortgage
$221,350
Interest Rate
7.43%
Purchase Details
Closed on
Jul 21, 1997
Sold by
Sommer Loren O Trust Of 1993 and Susan A
Bought by
Sommer Susan A and Sommer Gary L
Home Financials for this Owner
Home Financials are based on the most recent Mortgage that was taken out on this home.
Original Mortgage
$221,350
Interest Rate
7.43%
Purchase Details
Closed on
Jun 9, 1994
Sold by
Sommer Loren O
Bought by
Sommer Loren O
Create a Home Valuation Report for This Property
The Home Valuation Report is an in-depth analysis detailing your home's value as well as a comparison with similar homes in the area
Home Values in the Area
Average Home Value in this Area
Purchase History
| Date | Buyer | Sale Price | Title Company |
|---|---|---|---|
| Davis Richard L | -- | None Available | |
| Davis Richard L | -- | Amrock Inc | |
| Davis Richard L | $233,000 | Old Republic Title Company | |
| Sommer Susan A | -- | Old Republic Title | |
| Sommer Loren O | -- | -- |
Source: Public Records
Mortgage History
| Date | Status | Borrower | Loan Amount |
|---|---|---|---|
| Previous Owner | Davis Richard L | $426,000 | |
| Previous Owner | Davis Richard L | $221,350 |
Source: Public Records
Tax History Compared to Growth
Tax History
| Year | Tax Paid | Tax Assessment Tax Assessment Total Assessment is a certain percentage of the fair market value that is determined by local assessors to be the total taxable value of land and additions on the property. | Land | Improvement |
|---|---|---|---|---|
| 2025 | $6,741 | $388,688 | $111,607 | $284,081 |
| 2024 | $6,741 | $380,931 | $109,419 | $278,512 |
| 2023 | $7,006 | $380,326 | $107,274 | $273,052 |
| 2022 | $6,519 | $346,568 | $105,170 | $248,398 |
| 2021 | $6,119 | $336,695 | $103,108 | $240,587 |
| 2020 | $6,049 | $340,172 | $102,051 | $238,121 |
| 2019 | $5,774 | $333,504 | $100,051 | $233,453 |
| 2018 | $5,652 | $326,965 | $98,089 | $228,876 |
| 2017 | $5,418 | $320,556 | $96,167 | $224,389 |
| 2016 | $5,193 | $314,271 | $94,281 | $219,990 |
| 2015 | $5,160 | $309,551 | $92,865 | $216,686 |
| 2014 | $5,447 | $303,488 | $91,046 | $212,442 |
Source: Public Records
Map
Nearby Homes
- 4146 Gregory St
- 0 Redwood Rd Unit 41106996
- 4230 Terrabella Way
- 3546 Willis Ct
- 3529 Jordan Rd
- 4200 Terrabella Way
- 4007 Vale Ave
- 3611 Virden Ave
- 4320 Terrabella Way
- 4020 Maybelle Ave
- 4433 Fair Ave
- 4449 Mattis Ct
- 3911 Vale Ave
- 3616 Wisconsin St
- 4384 Redwood Rd
- 353 Crestmont Dr
- 3961 Magee Ave
- 4545 Tompkins Ave
- 3330 Monterey Blvd
- 3332 Victor Ave
- 4337 Anderson Ave
- 4349 Anderson Ave
- 4355 Anderson Ave
- 4307 Anderson Ave
- 4301 Anderson Ave
- 3927 Reinhardt Dr
- 68 Selkirk St
- 74 Selkirk St
- 4344 Anderson Ave
- 4336 Anderson Ave
- 4352 Anderson Ave
- 3919 Reinhardt Dr
- 4328 Anderson Ave
- 80 Selkirk St
- 4312 Anderson Ave
- 4409 Anderson Ave
- 86 Selkirk St
- 3932 Reinhardt Dr
- 4354 39th Ave
- 4366 39th Ave