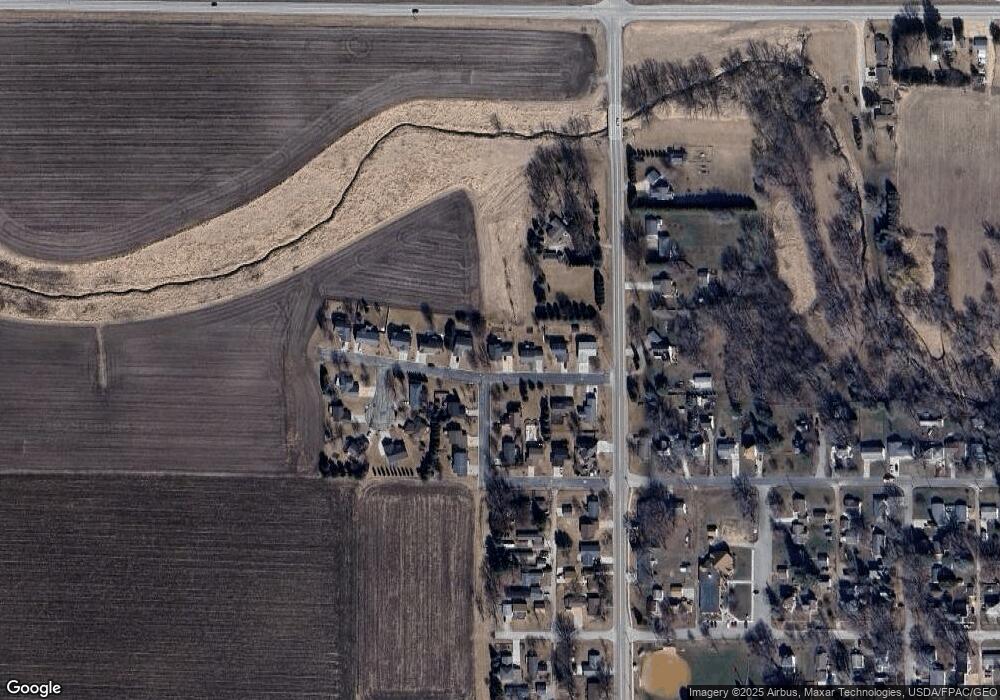
Estimated Value: $322,000 - $336,000
4
Beds
3
Baths
2,473
Sq Ft
$132/Sq Ft
Est. Value
About This Home
This home is located at 435 3rd St NW, Elgin, MN 55932 and is currently estimated at $326,697, approximately $132 per square foot. 435 3rd St NW is a home located in Wabasha County with nearby schools including Plainview-Elgin-Millville Elementary School (PK-3), Plainview-Elgin-Millville Elementary School (4-6), and Plainview-Elgin-Millville Junior High School.
Ownership History
Date
Name
Owned For
Owner Type
Purchase Details
Closed on
Jun 15, 2010
Sold by
Sadler Jeffrey J and Sadler Jennifer L
Bought by
Turri Richard J and Beauchamp Lorie Jean
Current Estimated Value
Home Financials for this Owner
Home Financials are based on the most recent Mortgage that was taken out on this home.
Original Mortgage
$169,100
Outstanding Balance
$113,775
Interest Rate
5.05%
Mortgage Type
New Conventional
Estimated Equity
$212,922
Purchase Details
Closed on
Aug 29, 2008
Sold by
Boraas Michael A and Boraas Tiffany S
Bought by
Sadler Jeffrey J and Sadler Jennfier L
Home Financials for this Owner
Home Financials are based on the most recent Mortgage that was taken out on this home.
Original Mortgage
$21,000
Interest Rate
6.31%
Mortgage Type
Future Advance Clause Open End Mortgage
Create a Home Valuation Report for This Property
The Home Valuation Report is an in-depth analysis detailing your home's value as well as a comparison with similar homes in the area
Purchase History
| Date | Buyer | Sale Price | Title Company |
|---|---|---|---|
| Turri Richard J | $178,000 | Edina Realty Title | |
| Sadler Jeffrey J | -- | None Available |
Source: Public Records
Mortgage History
| Date | Status | Borrower | Loan Amount |
|---|---|---|---|
| Open | Turri Richard J | $169,100 | |
| Previous Owner | Sadler Jeffrey J | $21,000 | |
| Previous Owner | Sadler Jeffrey J | $140,000 |
Source: Public Records
Tax History Compared to Growth
Tax History
| Year | Tax Paid | Tax Assessment Tax Assessment Total Assessment is a certain percentage of the fair market value that is determined by local assessors to be the total taxable value of land and additions on the property. | Land | Improvement |
|---|---|---|---|---|
| 2025 | $3,426 | $290,300 | $40,000 | $250,300 |
| 2024 | $3,426 | $271,200 | $40,000 | $231,200 |
| 2023 | $3,146 | $269,900 | $40,000 | $229,900 |
| 2022 | $2,684 | $246,200 | $36,000 | $210,200 |
| 2021 | $2,680 | $196,100 | $27,000 | $169,100 |
| 2020 | $2,718 | $193,400 | $27,000 | $166,400 |
| 2019 | $2,670 | $194,400 | $27,000 | $167,400 |
| 2018 | $2,118 | $186,800 | $27,000 | $159,800 |
| 2017 | $2,224 | $160,400 | $27,000 | $133,400 |
| 2016 | $2,254 | $0 | $0 | $0 |
| 2015 | $2,254 | $0 | $0 | $0 |
| 2012 | $2,544 | $0 | $0 | $0 |
Source: Public Records
Map
Nearby Homes
- 145 4th Ave NW
- 135 5th Ave NW
- 240 1st St SW
- 655 1st St SE
- 675 1st St SE
- TBD Industrial Dr SE
- 80 Rolling Hills Dr
- 45 Rolling Hills Dr
- 115 Rolling Hills Dr
- 100 Rolling Hills Dr
- 90 Rolling Hills Dr
- 110 Rolling Hills Dr
- 85 Rolling Hills Dr
- 105 Rolling Hills Dr
- 50352 Highway 42
- TBD 75th St
- 53022 253rd Ave
- 407 8th St SW
- 105 10th St NW
- 300 7th St SW
- 435 435 3rd-Street-nw
- 425 3rd St NW
- 505 3rd St NW
- 220 5th Ave NW
- 515 3rd St NW
- 225 5th Ave NW
- 405 3rd St NW
- 405 405 3rd-Street-nw
- 410 3rd St NW
- 525 3rd St NW
- 230 6th Ct NW
- 215 5th Ave NW
- 210 5th Ave NW
- 235 4th Ave NW
- 425 2nd St NW
- 220 6th Ct NW
- 415 2nd St NW
- 415 415 2nd-Street-nw
- 339 4th Ave NW
- 205 5th Ave NW
