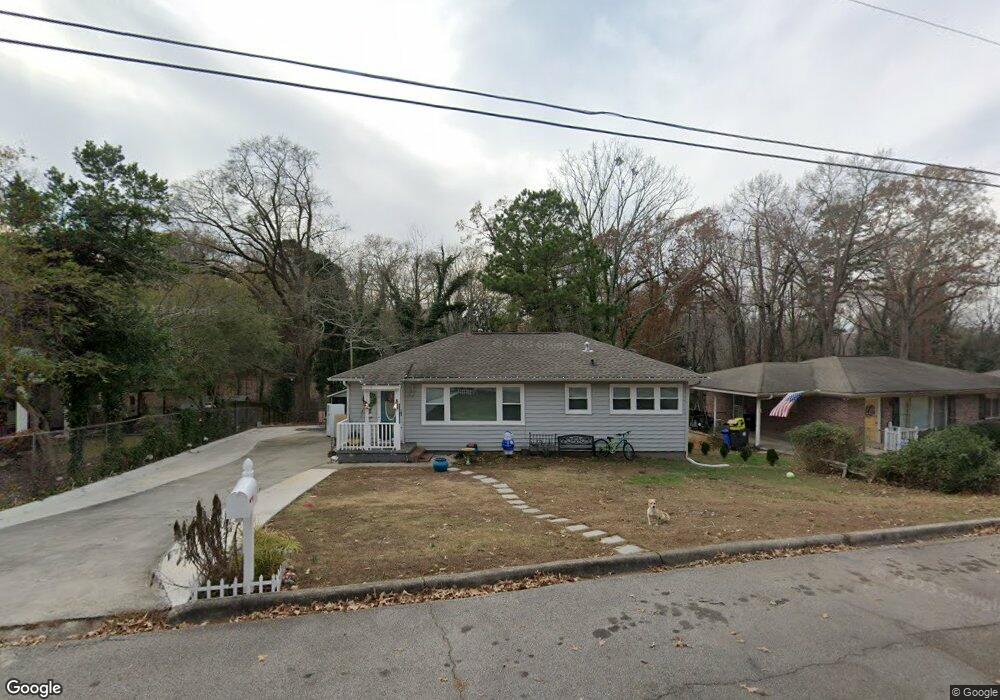
435 Christopher Dr Gainesville, GA 30501
Estimated Value: $217,000 - $265,000
2
Beds
1
Bath
960
Sq Ft
$245/Sq Ft
Est. Value
About This Home
This home is located at 435 Christopher Dr, Gainesville, GA 30501 and is currently estimated at $234,979, approximately $244 per square foot. 435 Christopher Dr is a home located in Hall County with nearby schools including Centennial Arts Academy, Gainesville Middle School, and Gainesville High School.
Ownership History
Date
Name
Owned For
Owner Type
Purchase Details
Closed on
Nov 4, 2022
Sold by
Freeman Jerry L
Bought by
Labrador Filomeno Julio Cesar and Ramirez Reyes Sofia
Current Estimated Value
Home Financials for this Owner
Home Financials are based on the most recent Mortgage that was taken out on this home.
Original Mortgage
$180,000
Outstanding Balance
$170,775
Interest Rate
6.94%
Mortgage Type
New Conventional
Estimated Equity
$64,204
Purchase Details
Closed on
Jul 9, 2014
Sold by
Lester Steve
Bought by
Freeman Jerry L and Freeman Wanda
Purchase Details
Closed on
Apr 16, 2009
Sold by
Ek Martin Sr Properties Llc
Bought by
Lester Steve
Home Financials for this Owner
Home Financials are based on the most recent Mortgage that was taken out on this home.
Original Mortgage
$153,718
Interest Rate
5.18%
Mortgage Type
New Conventional
Purchase Details
Closed on
Jan 9, 2009
Sold by
Lester Lajuania
Bought by
Ek Martin Sr Properties Llc
Purchase Details
Closed on
Feb 5, 1998
Sold by
Lester Stephen A
Bought by
Lester Lajuania
Create a Home Valuation Report for This Property
The Home Valuation Report is an in-depth analysis detailing your home's value as well as a comparison with similar homes in the area
Home Values in the Area
Average Home Value in this Area
Purchase History
| Date | Buyer | Sale Price | Title Company |
|---|---|---|---|
| Labrador Filomeno Julio Cesar | $180,000 | -- | |
| Freeman Jerry L | $40,000 | -- | |
| Lester Steve | $190,000 | -- | |
| Ek Martin Sr Properties Llc | $175,000 | -- | |
| Lester Lajuania | -- | -- |
Source: Public Records
Mortgage History
| Date | Status | Borrower | Loan Amount |
|---|---|---|---|
| Open | Labrador Filomeno Julio Cesar | $180,000 | |
| Previous Owner | Lester Steve | $153,718 |
Source: Public Records
Tax History
| Year | Tax Paid | Tax Assessment Tax Assessment Total Assessment is a certain percentage of the fair market value that is determined by local assessors to be the total taxable value of land and additions on the property. | Land | Improvement |
|---|---|---|---|---|
| 2025 | $2,040 | $91,040 | $19,800 | $71,240 |
| 2024 | $2,346 | $82,200 | $18,680 | $63,520 |
| 2023 | $2,103 | $83,520 | $20,920 | $62,600 |
| 2022 | $287 | $60,800 | $12,640 | $48,160 |
| 2021 | $247 | $47,360 | $10,080 | $37,280 |
| 2020 | $1,373 | $45,680 | $10,480 | $35,200 |
| 2019 | $1,175 | $38,520 | $10,480 | $28,040 |
| 2018 | $182 | $30,760 | $10,480 | $20,280 |
| 2017 | $202 | $30,196 | $10,480 | $19,716 |
| 2016 | $915 | $30,196 | $10,480 | $19,716 |
| 2015 | $481 | $24,796 | $5,080 | $19,716 |
| 2014 | $481 | $24,796 | $5,080 | $19,716 |
Source: Public Records
Map
Nearby Homes
- 394 Christopher Dr
- 456 Christopher Dr
- 344 Holly Dr
- 1510 Enota Ave NW
- 1015 Holly Dr Unit 804
- 1015 Holly Dr
- 850 Piedmont Rd
- 295 Oakland Dr
- 1012 Tanglewood Dr
- 698 Holly Dr
- 372 Oakland Dr
- 516 Stillwood Dr
- 1223 Bloomsbury Ln
- 576 Stillwood Dr
- 783 Holly Dr
- 825 Beverly Dr
- 1449 Walker St
- 670 Harbor Cove
- 318 Vinings Walk NW
- 311 Vinings Walk NW
- 439 Christopher Dr
- 429 Christopher Dr
- 445 Christopher Dr
- 417 Christopher Dr
- 455 Christopher Dr
- 434 Christopher Dr
- 440 Christopher Dr
- 411 Christopher Dr
- 444 Christopher Dr
- 1352 Montrose Dr
- 461 Christopher Dr
- 1360 Montrose Dr
- 409 Christopher Dr
- 405 Laura Dr NW
- 430 Christopher Ct
- 1380 Montrose Dr
- 1356 Montrose Dr
- 473 Christopher Dr
- 393 Laura Dr NW
- 405 Christopher Dr
Your Personal Tour Guide
Ask me questions while you tour the home.