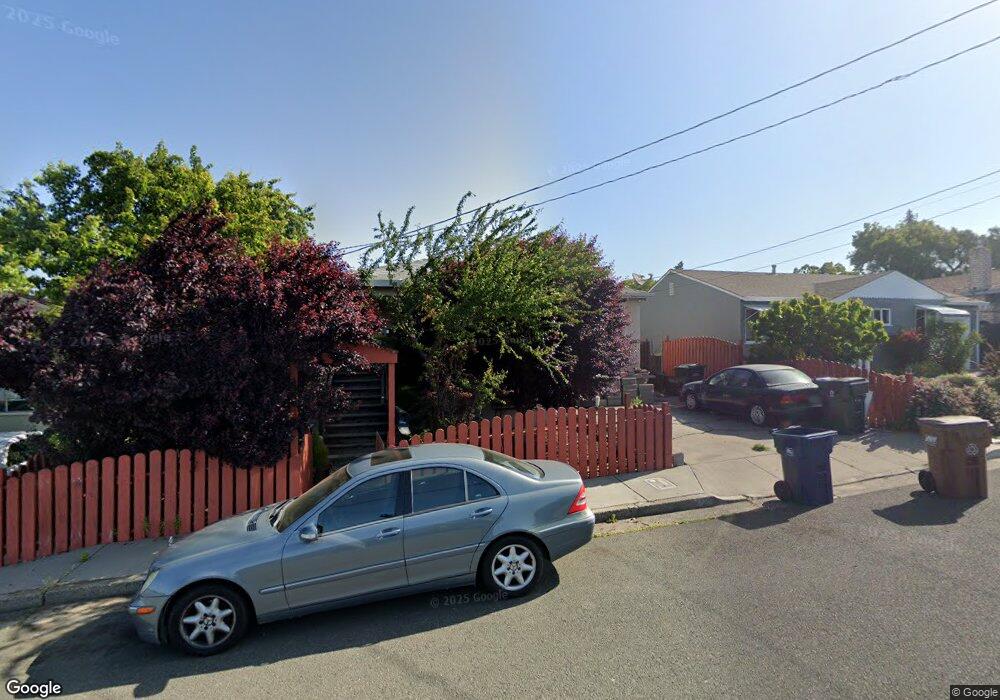
435 E K St Benicia, CA 94510
Estimated Value: $598,915 - $776,000
3
Beds
1
Bath
1,096
Sq Ft
$646/Sq Ft
Est. Value
About This Home
This home is located at 435 E K St, Benicia, CA 94510 and is currently estimated at $708,229, approximately $646 per square foot. 435 E K St is a home located in Solano County with nearby schools including Mary Farmar Elementary School, Benicia Middle School, and Benicia High School.
Ownership History
Date
Name
Owned For
Owner Type
Purchase Details
Closed on
Jan 7, 2026
Sold by
Zaro Priscilla Lee
Bought by
Zaro Norman A
Current Estimated Value
Purchase Details
Closed on
Jun 16, 2004
Sold by
Zaro Julianne
Bought by
Zaro Norman A and Zaro Priscilla L
Purchase Details
Closed on
Aug 7, 1999
Sold by
Zaro Julianne
Bought by
Zaro Julianne
Home Financials for this Owner
Home Financials are based on the most recent Mortgage that was taken out on this home.
Original Mortgage
$91,000
Interest Rate
2.95%
Create a Home Valuation Report for This Property
The Home Valuation Report is an in-depth analysis detailing your home's value as well as a comparison with similar homes in the area
Home Values in the Area
Average Home Value in this Area
Purchase History
| Date | Buyer | Sale Price | Title Company |
|---|---|---|---|
| Zaro Norman A | -- | None Listed On Document | |
| Zaro Norman A | -- | None Available | |
| Zaro Julianne | -- | North American Title Co |
Source: Public Records
Mortgage History
| Date | Status | Borrower | Loan Amount |
|---|---|---|---|
| Previous Owner | Zaro Julianne | $91,000 |
Source: Public Records
Tax History
| Year | Tax Paid | Tax Assessment Tax Assessment Total Assessment is a certain percentage of the fair market value that is determined by local assessors to be the total taxable value of land and additions on the property. | Land | Improvement |
|---|---|---|---|---|
| 2025 | $698 | $58,635 | $14,078 | $44,557 |
| 2024 | $698 | $57,486 | $13,802 | $43,684 |
| 2023 | $682 | $56,360 | $13,532 | $42,828 |
| 2022 | $669 | $55,256 | $13,267 | $41,989 |
| 2021 | $656 | $54,173 | $13,007 | $41,166 |
| 2020 | $647 | $53,618 | $12,874 | $40,744 |
| 2019 | $636 | $52,568 | $12,622 | $39,946 |
| 2018 | $620 | $51,538 | $12,375 | $39,163 |
| 2017 | $606 | $50,529 | $12,133 | $38,396 |
| 2016 | $600 | $49,540 | $11,896 | $37,644 |
| 2015 | $585 | $48,797 | $11,718 | $37,079 |
| 2014 | $578 | $47,842 | $11,489 | $36,353 |
Source: Public Records
Map
Nearby Homes
Your Personal Tour Guide
Ask me questions while you tour the home.