435 Jackson St Fall River, MA 02721
Maplewood NeighborhoodEstimated Value: $417,288 - $520,000
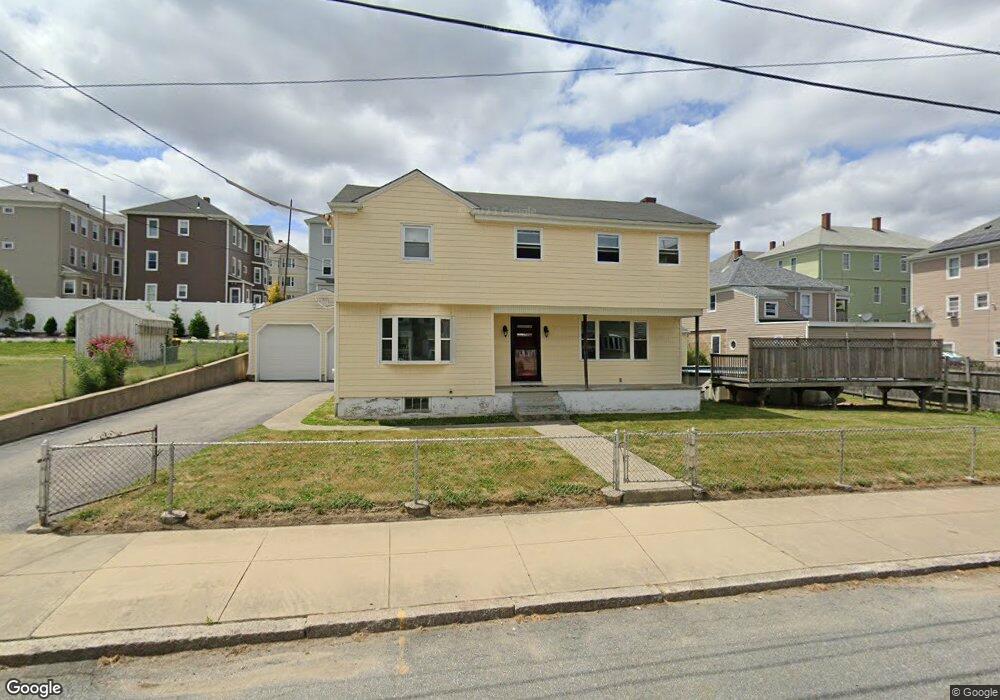
About This Home
This home is located at 435 Jackson St, Fall River, MA 02721 and is currently estimated at $461,572, approximately $324 per square foot. 435 Jackson St is a home located in Bristol County with nearby schools including Letourneau Elementary School, Talbot Innovation School, and B M C Durfee High School.
Ownership History
We collect this data history from publicly available records. To have your information removed, we recommend requesting removal directly through your county’s website.
Purchase Details
Home Financials for this Owner
Home Financials are based on the most recent Mortgage that was taken out on this home.Purchase Details
Purchase Details
Home Financials for this Owner
Home Financials are based on the most recent Mortgage that was taken out on this home.Purchase Details
Home Financials for this Owner
Home Financials are based on the most recent Mortgage that was taken out on this home.Purchase Details
Home Values in the Area
Average Home Value in this Area
Purchase History
We collect this data history from publicly available records. To have your information removed, we recommend requesting removal directly through your county’s website.
| Date | Buyer | Sale Price | Title Company |
|---|---|---|---|
| -- | -- | ||
| -- | -- | ||
| $260,000 | -- | ||
| -- | -- | ||
| $169,900 | -- |
Mortgage History
We collect this data history from publicly available records. To have your information removed, we recommend requesting removal directly through your county’s website.
| Date | Status | Borrower | Loan Amount |
|---|---|---|---|
| Open | $228,400 | ||
| Previous Owner | $247,000 | ||
| Previous Owner | $28,000 | ||
| Previous Owner | $172,000 | ||
| Previous Owner | $167,400 |
Tax History
We collect this data history from publicly available records. To have your information removed, we recommend requesting removal directly through your county’s website.
| Year | Tax Paid | Tax Assessment Tax Assessment Total Assessment is a certain percentage of the fair market value that is determined by local assessors to be the total taxable value of land and additions on the property. | Land | Improvement |
|---|---|---|---|---|
| 2025 | $3,683 | $321,700 | $130,600 | $191,100 |
| 2024 | $3,463 | $301,400 | $125,600 | $175,800 |
| 2023 | $3,406 | $277,600 | $107,700 | $169,900 |
| 2022 | $3,055 | $242,100 | $97,900 | $144,200 |
| 2021 | $2,987 | $216,000 | $90,600 | $125,400 |
| 2020 | $2,949 | $204,100 | $86,700 | $117,400 |
| 2019 | $2,843 | $195,000 | $82,600 | $112,400 |
| 2018 | $2,785 | $190,500 | $81,100 | $109,400 |
| 2017 | $2,667 | $190,500 | $82,700 | $107,800 |
| 2016 | $2,567 | $188,300 | $86,100 | $102,200 |
| 2015 | $2,432 | $185,900 | $82,900 | $103,000 |
| 2014 | $2,394 | $190,300 | $87,300 | $103,000 |
Map
- 217 Brayton Ave
- 1350 Rodman St
- 45 Bright St
- 649 Stafford Rd
- 52 Lapham St
- 582 Cambridge St
- 49 Denver St
- 69 Denver St
- 529 Warren St
- 321 Embert St
- 87 Smith St
- 239 Glasgow St Unit 10
- 449 Chicago St
- 248 Jefferson St
- 477 Palmer St
- 147 Jefferson St
- 478 Tucker St
- 1264 Plymouth Ave
- 1138 Plymouth Ave
- 1142-1144 Plymouth Ave
Ask me questions while you tour the home.