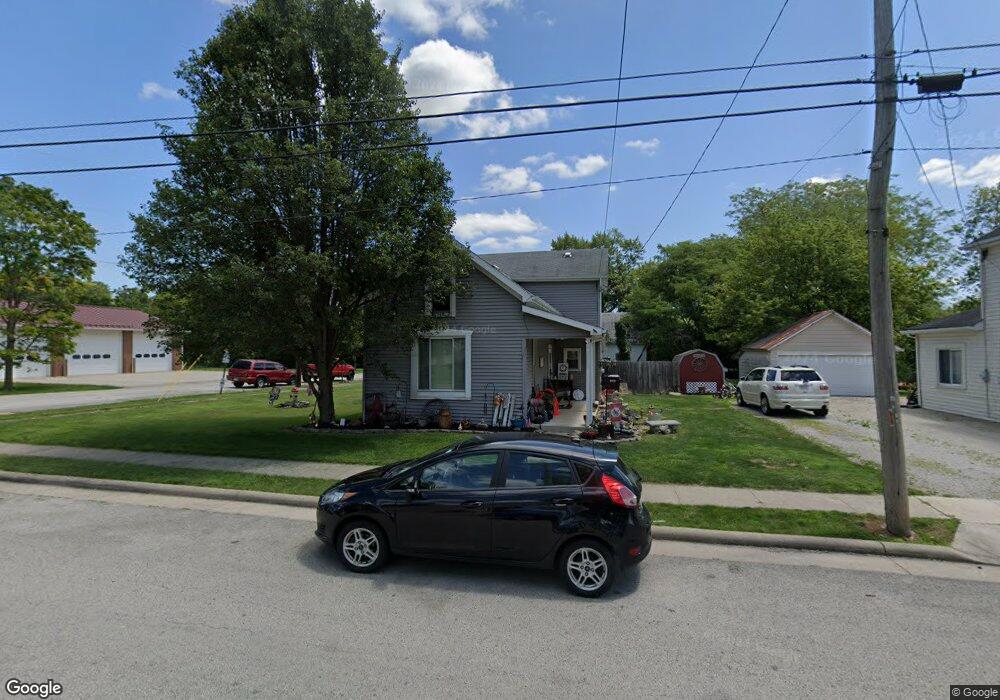
435 N Bridge St Gettysburg, OH 45328
Estimated Value: $106,000 - $135,000
3
Beds
1
Bath
1,504
Sq Ft
$82/Sq Ft
Est. Value
About This Home
This home is located at 435 N Bridge St, Gettysburg, OH 45328 and is currently estimated at $122,605, approximately $81 per square foot. 435 N Bridge St is a home with nearby schools including Greenville Middle School, Greenville Intermediate School, and Greenville Primary School.
Ownership History
Date
Name
Owned For
Owner Type
Purchase Details
Closed on
Aug 7, 2006
Sold by
Layman Tyler J
Bought by
Sargent Shane
Current Estimated Value
Home Financials for this Owner
Home Financials are based on the most recent Mortgage that was taken out on this home.
Original Mortgage
$69,900
Outstanding Balance
$42,126
Interest Rate
6.83%
Mortgage Type
Purchase Money Mortgage
Estimated Equity
$80,479
Purchase Details
Closed on
Nov 16, 2004
Sold by
Baker James R and Baker Kimberly D
Bought by
Layman Tyler J
Home Financials for this Owner
Home Financials are based on the most recent Mortgage that was taken out on this home.
Original Mortgage
$49,600
Interest Rate
5%
Mortgage Type
Purchase Money Mortgage
Purchase Details
Closed on
Mar 1, 2001
Sold by
United Co Lending Corp
Bought by
Baker James R and Baker Kimberly
Purchase Details
Closed on
Jun 1, 1990
Bought by
Sargent Shane
Create a Home Valuation Report for This Property
The Home Valuation Report is an in-depth analysis detailing your home's value as well as a comparison with similar homes in the area
Home Values in the Area
Average Home Value in this Area
Purchase History
| Date | Buyer | Sale Price | Title Company |
|---|---|---|---|
| Sargent Shane | $69,900 | Custom Title Services Llc | |
| Layman Tyler J | $62,000 | -- | |
| Baker James R | $44,000 | -- | |
| Sargent Shane | $26,000 | -- |
Source: Public Records
Mortgage History
| Date | Status | Borrower | Loan Amount |
|---|---|---|---|
| Open | Sargent Shane | $69,900 | |
| Previous Owner | Layman Tyler J | $49,600 | |
| Closed | Layman Tyler J | $6,138 |
Source: Public Records
Tax History Compared to Growth
Tax History
| Year | Tax Paid | Tax Assessment Tax Assessment Total Assessment is a certain percentage of the fair market value that is determined by local assessors to be the total taxable value of land and additions on the property. | Land | Improvement |
|---|---|---|---|---|
| 2024 | $977 | $27,140 | $5,670 | $21,470 |
| 2023 | $977 | $27,140 | $5,670 | $21,470 |
| 2022 | $827 | $20,850 | $4,730 | $16,120 |
| 2021 | $830 | $20,850 | $4,730 | $16,120 |
| 2020 | $832 | $20,850 | $4,730 | $16,120 |
| 2019 | $806 | $20,080 | $4,730 | $15,350 |
| 2018 | $849 | $20,080 | $4,730 | $15,350 |
| 2017 | $758 | $20,080 | $4,730 | $15,350 |
| 2016 | $707 | $17,430 | $4,750 | $12,680 |
| 2015 | $707 | $17,430 | $4,750 | $12,680 |
| 2014 | $708 | $17,430 | $4,750 | $12,680 |
| 2013 | $738 | $18,100 | $4,750 | $13,350 |
Source: Public Records
Map
Nearby Homes
- 107 Mary St
- 133 Dorwin St
- 6350 Arcanum Bears Mill Rd
- 6350 Arcanum Bearsmill Rd
- 211 W Elm St
- 8363 Horatio-New Harrison Rd
- 206 W Elm St
- 142 W James St
- 6459 US Route 36
- 9983 New Harrison-Bradford Rd
- 9983 New Harrison Bradford Rd
- 124 E Keller St
- 324 E Elm St
- 6216 US Route 36
- 9072 Stillwater Dr
- 10770 U S 36
- 5858 Wood Ave
- 5834 Lake Ave
- 2288 N State Route 721
- 5535 Auburn Dr
- 423 N Bridge St
- 415 N Bridge St
- 428 N Bridge St
- 436 N Bridge St
- 115 Park St
- 504 N Bridge St
- 407 N Bridge St
- 408 N Bridge St
- 121 Park St
- 401 N Bridge St
- 521 N Bridge St
- 518 N Bridge St
- 571 N Bridge St
- 348 N Bridge St
- 349 N Bridge St
- 532 N Bridge St
- 127 Park Ave
- 127 Park St
- 341 N Bridge St
- 148 W Main St