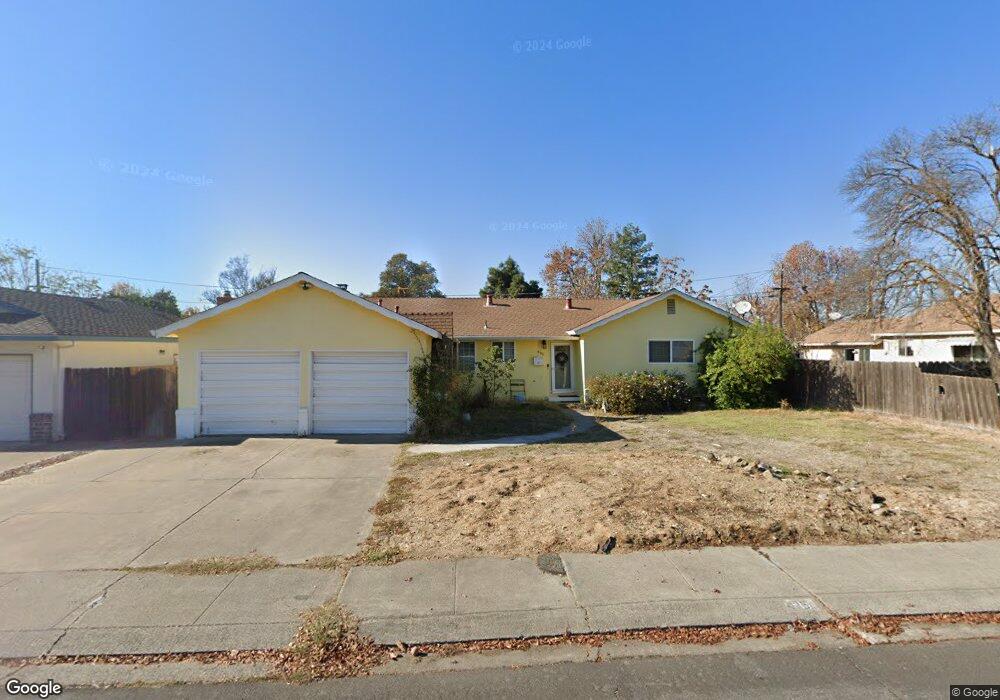
435 N Fremont St Manteca, CA 95336
Downtown Manteca NeighborhoodEstimated Value: $448,238 - $503,000
3
Beds
2
Baths
1,419
Sq Ft
$340/Sq Ft
Est. Value
About This Home
This home is located at 435 N Fremont St, Manteca, CA 95336 and is currently estimated at $481,810, approximately $339 per square foot. 435 N Fremont St is a home located in San Joaquin County with nearby schools including Shasta Elementary School, Manteca High School, and St. Anthony's Catholic School.
Ownership History
Date
Name
Owned For
Owner Type
Purchase Details
Closed on
Aug 29, 2002
Sold by
Lemay Ronnie E and Lemay Jennifer R
Bought by
Hoffman Scott and Hoffman Karice
Current Estimated Value
Home Financials for this Owner
Home Financials are based on the most recent Mortgage that was taken out on this home.
Original Mortgage
$235,870
Outstanding Balance
$98,890
Interest Rate
6.29%
Estimated Equity
$382,920
Purchase Details
Closed on
Feb 29, 2000
Sold by
Holly N Trs
Bought by
Lemay Ronnie E and Lemay Jennifer R
Home Financials for this Owner
Home Financials are based on the most recent Mortgage that was taken out on this home.
Original Mortgage
$127,319
Interest Rate
8.26%
Mortgage Type
FHA
Create a Home Valuation Report for This Property
The Home Valuation Report is an in-depth analysis detailing your home's value as well as a comparison with similar homes in the area
Home Values in the Area
Average Home Value in this Area
Purchase History
| Date | Buyer | Sale Price | Title Company |
|---|---|---|---|
| Hoffman Scott | $229,000 | Alliance Title Company | |
| Lemay Ronnie E | $129,000 | Central Valley Title Company |
Source: Public Records
Mortgage History
| Date | Status | Borrower | Loan Amount |
|---|---|---|---|
| Open | Hoffman Scott | $235,870 | |
| Previous Owner | Lemay Ronnie E | $127,319 |
Source: Public Records
Tax History Compared to Growth
Tax History
| Year | Tax Paid | Tax Assessment Tax Assessment Total Assessment is a certain percentage of the fair market value that is determined by local assessors to be the total taxable value of land and additions on the property. | Land | Improvement |
|---|---|---|---|---|
| 2025 | $2,051 | $183,196 | $44,836 | $138,360 |
| 2024 | $1,994 | $179,605 | $43,957 | $135,648 |
| 2023 | $1,970 | $176,085 | $43,096 | $132,989 |
| 2022 | $1,940 | $172,633 | $42,251 | $130,382 |
| 2021 | $1,919 | $169,249 | $41,423 | $127,826 |
| 2020 | $1,842 | $167,515 | $40,999 | $126,516 |
| 2019 | $1,818 | $164,232 | $40,196 | $124,036 |
| 2018 | $1,794 | $161,012 | $39,408 | $121,604 |
| 2017 | $1,768 | $157,856 | $38,636 | $119,220 |
| 2016 | $1,726 | $154,762 | $37,879 | $116,883 |
| 2014 | $1,605 | $149,452 | $36,579 | $112,873 |
Source: Public Records
Map
Nearby Homes
- 232 N Sherman Ave
- 311 N Lincoln Ave
- 521 Emperor Ct
- 215 N Lincoln Ave
- 931 E North St
- 160 N Powers Ave
- 200 Dan St
- 1110 Aldwina Ln
- 116 W Yosemite Ave
- 1129 E Alameda St
- 231 Poplar Ave
- 427 Argonaut St
- 1003 Alfonso Ln
- 1065 Bristow St
- 396 Lancaster Dr
- 757-847 N Main St
- 406 Elm Ave
- 338 Cottage Ave
- 1015 Lucio St
- 344 Rose Garden Ct
- 429 N Fremont St
- 524 E Alameda St
- 425 N Fremont St
- 432 N Fremont St
- 428 N Fremont St
- 436 N Fremont St
- 424 N Fremont St
- 419 N Fremont St
- 448 E Alameda St
- 620 E Alameda St
- 420 N Fremont Ave
- 425 Orange Ct
- 485 E Alameda St
- 525 E Alameda St
- 420 N Fremont St
- 461 E Alameda St
- 465 E Alameda St
- 415 Orange Ct
- 435 Orange Ct
- 609 E Alameda St