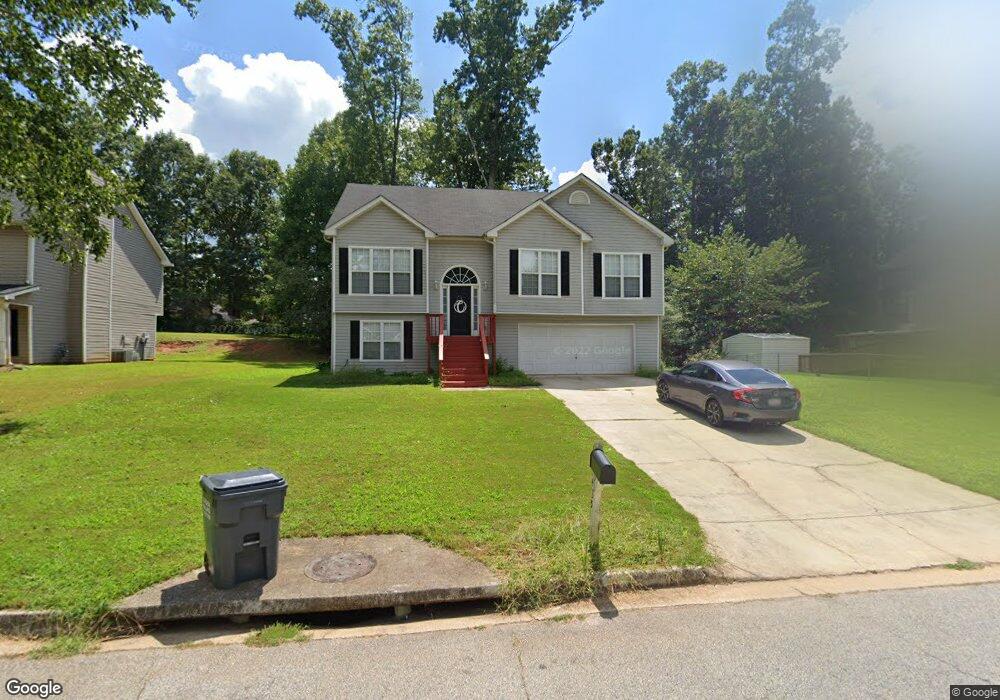
435 Princeton Way Covington, GA 30016
Estimated Value: $250,000 - $287,670
Studio
3
Baths
1,581
Sq Ft
$170/Sq Ft
Est. Value
About This Home
This home is located at 435 Princeton Way, Covington, GA 30016 and is currently estimated at $269,418, approximately $170 per square foot. 435 Princeton Way is a home located in Newton County with nearby schools including Live Oak Elementary School, Clements Middle School, and Newton High School.
Ownership History
Date
Name
Owned For
Owner Type
Purchase Details
Closed on
Jan 28, 2022
Sold by
Boulton Properties Llc
Bought by
New Residential Borrower 2022 Sfr1
Current Estimated Value
Purchase Details
Closed on
Mar 12, 2021
Sold by
2Nd Generation Shipman Llc
Bought by
Boulton Properties Llc
Purchase Details
Closed on
Feb 2, 2021
Sold by
Love Smith Myia Rosetta
Bought by
2Nd Generation Shipman Llc
Purchase Details
Closed on
May 6, 2014
Sold by
Love-Smith Myia
Bought by
Love-Smith Myia Rosetta and Kenney Craig Vincent
Purchase Details
Closed on
Apr 1, 2013
Sold by
Odom-Bey Myia
Bought by
Love-Smith Myia Rosetta
Purchase Details
Closed on
Apr 27, 2001
Sold by
Premier Homecrafters Inc
Bought by
Clark Myia S
Home Financials for this Owner
Home Financials are based on the most recent Mortgage that was taken out on this home.
Original Mortgage
$134,883
Interest Rate
6.95%
Mortgage Type
FHA
Create a Home Valuation Report for This Property
The Home Valuation Report is an in-depth analysis detailing your home's value as well as a comparison with similar homes in the area
Home Values in the Area
Average Home Value in this Area
Purchase History
| Date | Buyer | Sale Price | Title Company |
|---|---|---|---|
| New Residential Borrower 2022 Sfr1 | -- | -- | |
| Boulton Properties Llc | $190,000 | -- | |
| 2Nd Generation Shipman Llc | $156,000 | -- | |
| Love-Smith Myia Rosetta | -- | -- | |
| Love-Smith Myia Rosetta | -- | -- | |
| Clark Myia S | $137,000 | -- |
Source: Public Records
Mortgage History
| Date | Status | Borrower | Loan Amount |
|---|---|---|---|
| Previous Owner | Clark Myia S | $134,883 |
Source: Public Records
Tax History
| Year | Tax Paid | Tax Assessment Tax Assessment Total Assessment is a certain percentage of the fair market value that is determined by local assessors to be the total taxable value of land and additions on the property. | Land | Improvement |
|---|---|---|---|---|
| 2025 | $2,777 | $110,037 | $14,843 | $95,194 |
| 2024 | $3,366 | $131,320 | $18,000 | $113,320 |
| 2023 | $3,167 | $115,280 | $7,200 | $108,080 |
| 2022 | $2,663 | $96,680 | $7,200 | $89,480 |
| 2021 | $2,455 | $83,560 | $7,200 | $76,360 |
| 2020 | $2,352 | $72,800 | $7,200 | $65,600 |
| 2019 | $2,219 | $67,840 | $7,200 | $60,640 |
| 2018 | $2,043 | $62,320 | $7,200 | $55,120 |
| 2017 | $1,646 | $50,760 | $7,200 | $43,560 |
| 2016 | $1,497 | $46,400 | $5,600 | $40,800 |
| 2015 | $1,444 | $44,840 | $5,600 | $39,240 |
| 2014 | $1,146 | $36,240 | $0 | $0 |
Source: Public Records
Map
Nearby Homes
- 1040 Kirkland Rd
- 200 Syracuse Ln
- 160 Princeton Way
- 105 Queensland Ln
- 1240 Kirkland Rd
- 200 Queensland Ln
- 40 Bermuda Cir
- 275 Hoglen Dr
- 30 Capeton Ct
- 150 Stephanie Ln
- 185 Stephanie Ln
- 45 Robertford Dr
- 90 Windsong Dr
- 385 Creekview Blvd
- 40 Oak Terrace Dr
- 65 Rosewood Cir
- 160 Wisteria Blvd
- 220 Doubles Dr Unit 3
- 40 Willow Tree Terrace
- 35 Rolling Ridge Dr
- 425 Princeton Way
- 70 Syracuse Ln
- 80 Syracuse Ln
- 415 Princeton Way
- 100 Burdell Dr
- 90 Burdell Dr
- 90 Burdell Dr Unit 90
- 110 Burdell Dr
- 440 Princeton Way
- 100 Syracuse Ln
- 15 Dartmouth Ct
- 80 Burdell Dr
- 405 Princeton Way
- 60 Syracuse Ln
- 110 Syracuse Ln Unit 4
- 70 Burdell Dr
- 395 Princeton Way
- 75 Syracuse Ln
- 120 Syracuse Ln
- 85 Syracuse Ln
Your Personal Tour Guide
Ask me questions while you tour the home.