Estimated Value: $67,000 - $88,279
3
Beds
1
Bath
780
Sq Ft
$105/Sq Ft
Est. Value
About This Home
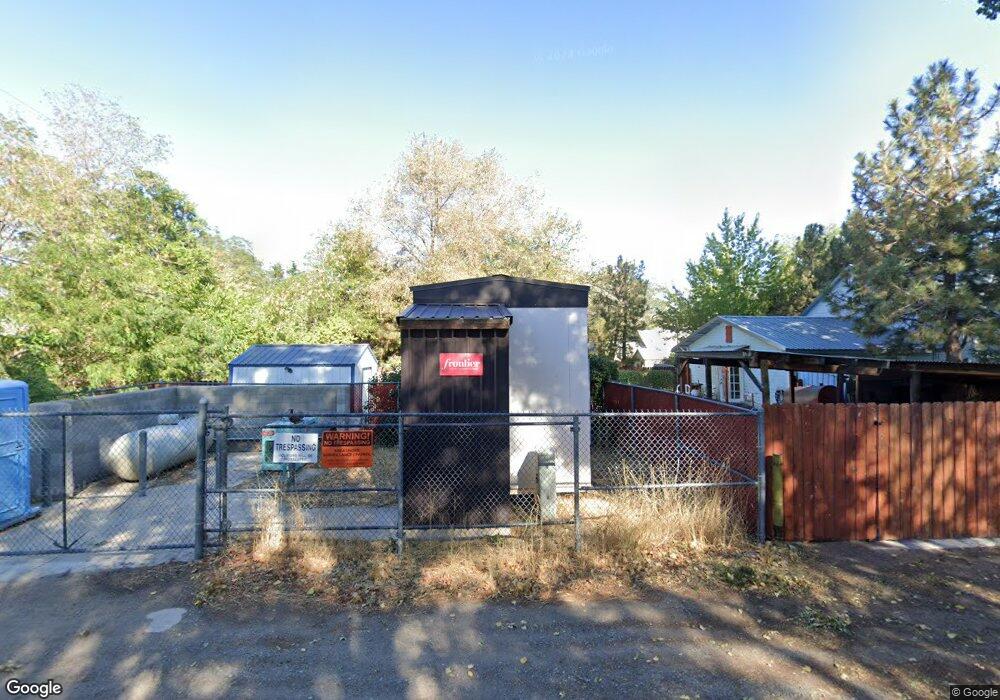
This home is located at 435 Third St, Doyle, CA 96109 and is currently estimated at $82,070, approximately $105 per square foot. 435 Third St is a home with nearby schools including Sierra Primary School, Fort Sage Middle School, and Herlong High School.
Ownership History
Date
Name
Owned For
Owner Type
Purchase Details
Closed on
Jan 31, 2022
Sold by
Auld Kenneth B
Bought by
Auld Pamela K
Current Estimated Value
Home Financials for this Owner
Home Financials are based on the most recent Mortgage that was taken out on this home.
Original Mortgage
$45,000
Outstanding Balance
$41,616
Interest Rate
3.22%
Mortgage Type
New Conventional
Estimated Equity
$40,454
Purchase Details
Closed on
Jan 27, 2022
Sold by
Auld Pamela K
Bought by
Phelps Melissa J
Home Financials for this Owner
Home Financials are based on the most recent Mortgage that was taken out on this home.
Original Mortgage
$45,000
Outstanding Balance
$41,616
Interest Rate
3.22%
Mortgage Type
New Conventional
Estimated Equity
$40,454
Purchase Details
Closed on
May 10, 2016
Sold by
Sustain Jessec
Bought by
Auld Pamela K and Crews Janet
Create a Home Valuation Report for This Property
The Home Valuation Report is an in-depth analysis detailing your home's value as well as a comparison with similar homes in the area
Purchase History
| Date | Buyer | Sale Price | Title Company |
|---|---|---|---|
| Auld Pamela K | -- | Chicago Title | |
| Phelps Melissa J | $60,000 | Chicago Title | |
| Auld Pamela K | -- | None Available |
Source: Public Records
Mortgage History
| Date | Status | Borrower | Loan Amount |
|---|---|---|---|
| Open | Phelps Melissa J | $45,000 |
Source: Public Records
Tax History
| Year | Tax Paid | Tax Assessment Tax Assessment Total Assessment is a certain percentage of the fair market value that is determined by local assessors to be the total taxable value of land and additions on the property. | Land | Improvement |
|---|---|---|---|---|
| 2025 | $624 | $63,672 | $10,612 | $53,060 |
| 2024 | $624 | $62,424 | $10,404 | $52,020 |
| 2023 | $612 | $61,200 | $10,200 | $51,000 |
| 2022 | $109 | $10,897 | $2,273 | $8,624 |
| 2021 | $107 | $10,684 | $2,229 | $8,455 |
| 2020 | $106 | $10,576 | $2,207 | $8,369 |
| 2019 | $104 | $10,369 | $2,164 | $8,205 |
| 2018 | $102 | $10,167 | $2,122 | $8,045 |
| 2017 | $100 | $9,969 | $2,081 | $7,888 |
| 2016 | $28 | $9,775 | $2,041 | $7,734 |
Source: Public Records
Map
Nearby Homes
- 480 U S 395
- 463505 Laura Dr
- 00 Susan Dr
- 000 Susan Dr
- 432-250 Constantia Rd
- 000 Dewey Ln
- 437-150 US Highway 395
- 437-700 Old Highway 395
- 436-755 Karen Dr
- 0 Cowboy Joe Rd
- 742-135 Cowboy Joe
- 434-100 Diamond Mountain Rd
- 000 Winters Rd
- 443-400 Garnier Rd
- 425-900 Constantia Rd
- 139-340-010 Garnier Rd
- xxxx Doyle Grade Rd
- 0 Hackstaff Rd
- 447-255 Nevada
- 137 Spruce St
Your Personal Tour Guide
Ask me questions while you tour the home.