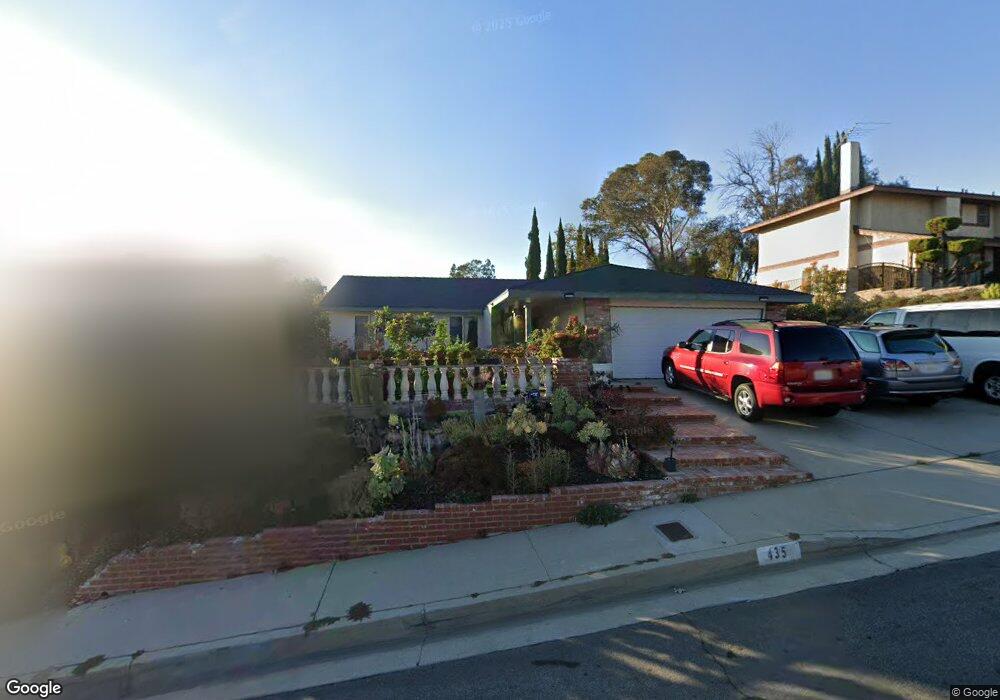
435 Via Quinto Walnut, CA 91789
Estimated Value: $957,665 - $1,039,000
3
Beds
2
Baths
1,521
Sq Ft
$658/Sq Ft
Est. Value
About This Home
This home is located at 435 Via Quinto, Walnut, CA 91789 and is currently estimated at $1,000,416, approximately $657 per square foot. 435 Via Quinto is a home located in Los Angeles County with nearby schools including Hollingworth Elementary School and Nogales High School.
Ownership History
Date
Name
Owned For
Owner Type
Purchase Details
Closed on
May 19, 2009
Sold by
Schrepferman Michael G
Bought by
Wang Hsiu Yin
Current Estimated Value
Purchase Details
Closed on
May 18, 2009
Sold by
Wang Tse Min
Bought by
Wang Hsiu Yin
Purchase Details
Closed on
Sep 11, 2008
Sold by
Sandoval David
Bought by
Schrepferman Michael G and Schrepferman Lorraine C
Purchase Details
Closed on
Apr 13, 1999
Sold by
Sandoval David
Bought by
Sandoval David
Home Financials for this Owner
Home Financials are based on the most recent Mortgage that was taken out on this home.
Original Mortgage
$180,700
Interest Rate
7.95%
Purchase Details
Closed on
Sep 12, 1995
Sold by
Sandoval David
Bought by
Sandoval David and Sandoval Teresa
Purchase Details
Closed on
Jan 18, 1995
Sold by
Chavez James R
Bought by
Sandoval David
Home Financials for this Owner
Home Financials are based on the most recent Mortgage that was taken out on this home.
Original Mortgage
$156,150
Interest Rate
8.86%
Create a Home Valuation Report for This Property
The Home Valuation Report is an in-depth analysis detailing your home's value as well as a comparison with similar homes in the area
Home Values in the Area
Average Home Value in this Area
Purchase History
| Date | Buyer | Sale Price | Title Company |
|---|---|---|---|
| Wang Hsiu Yin | $450,000 | Lawyers Title Company | |
| Wang Hsiu Yin | -- | Lawyers Title Company | |
| Schrepferman Michael G | $145,000 | North American Title Company | |
| Sandoval David | -- | -- | |
| Sandoval David | -- | -- | |
| Sandoval David | $173,500 | Stewart Title |
Source: Public Records
Mortgage History
| Date | Status | Borrower | Loan Amount |
|---|---|---|---|
| Previous Owner | Sandoval David | $180,700 | |
| Previous Owner | Sandoval David | $156,150 |
Source: Public Records
Tax History Compared to Growth
Tax History
| Year | Tax Paid | Tax Assessment Tax Assessment Total Assessment is a certain percentage of the fair market value that is determined by local assessors to be the total taxable value of land and additions on the property. | Land | Improvement |
|---|---|---|---|---|
| 2025 | $7,541 | $579,475 | $326,826 | $252,649 |
| 2024 | $7,541 | $568,114 | $320,418 | $247,696 |
| 2023 | $7,292 | $556,976 | $314,136 | $242,840 |
| 2022 | $7,139 | $546,056 | $307,977 | $238,079 |
| 2021 | $7,025 | $535,350 | $301,939 | $233,411 |
| 2019 | $6,822 | $519,473 | $292,984 | $226,489 |
| 2018 | $6,531 | $509,289 | $287,240 | $222,049 |
| 2016 | $6,298 | $489,515 | $276,087 | $213,428 |
| 2015 | $6,198 | $482,163 | $271,940 | $210,223 |
| 2014 | $6,189 | $472,720 | $266,614 | $206,106 |
Source: Public Records
Map
Nearby Homes
- 19569 Vista Hermosa Dr
- 244 Calle Luna
- 577 Chuck Wagon Cir
- 3228 La Puente Rd
- 3316 S Gauntlet Dr
- 19873 Calle Granada
- 3632 S Morganfield Ave
- 19440 Branding Iron Rd
- 653 Rocking Horse Rd
- 3659 Agate Way Unit 199
- 3449 E Calle Baja Dr
- 19178 Bel Air Dr
- 804 San Nicholas Dr
- 370 Camino de Teodoro
- 376 Camino de Teodoro
- 3538 Bottlebrush Unit 33
- 338 Calle Vista
- 315 S Sentous Ave
- 3860 Sycamore St
- 3616 Whittlers Ln
- 425 Via Quinto
- 439 Via Quinto
- 430 Calle Alcazar
- 411 Via Quinto
- 426 Calle Alcazar
- 449 Via Quinto
- 430 Via Quinto
- 436 Via Quinto
- 420 Calle Alcazar
- 420 Via Quinto
- 455 Via Quinto
- 440 Via Quinto
- 19621 Chalina Dr
- 19615 Chalina Dr
- 438 Calle Alcazar
- 410 Via Quinto
- 450 Via Quinto
- 19607 Chalina Dr
- 423 San Roque Dr
- 429 San Roque Dr