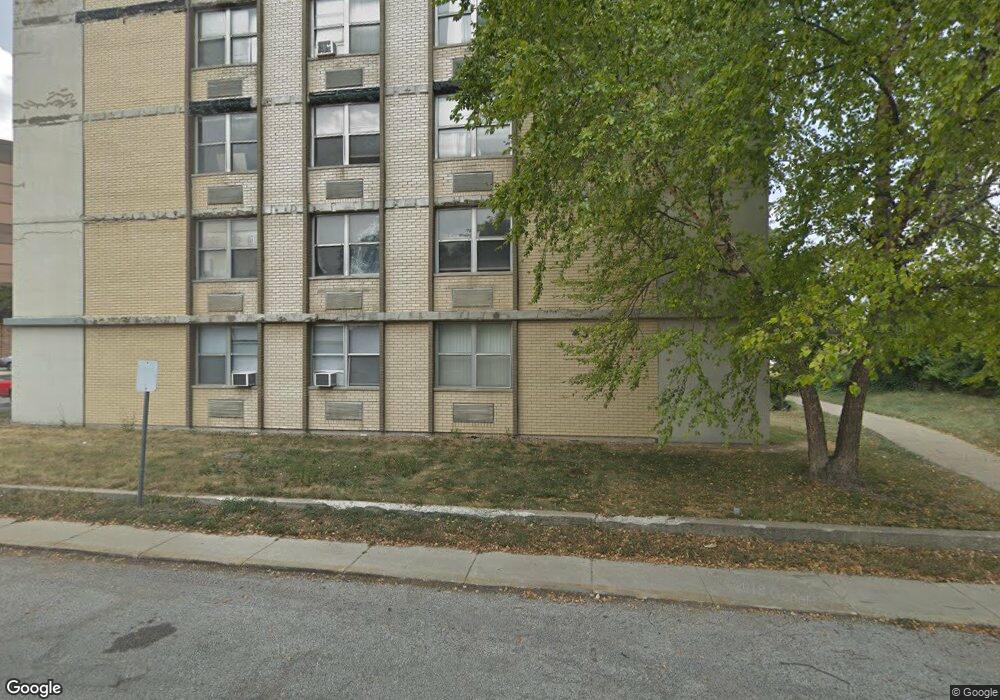
4351 W 76th St Unit C1104 Chicago, IL 60652
Scottsdale NeighborhoodEstimated Value: $50,971 - $77,000
3
Beds
2
Baths
5,300
Sq Ft
$11/Sq Ft
Est. Value
About This Home
This home is located at 4351 W 76th St Unit C1104, Chicago, IL 60652 and is currently estimated at $60,493, approximately $11 per square foot. 4351 W 76th St Unit C1104 is a home located in Cook County with nearby schools including Stevenson Elementary School, Bogan Computer Technical High School, and Queen Of The Universe School.
Ownership History
Date
Name
Owned For
Owner Type
Purchase Details
Closed on
Apr 15, 2019
Sold by
Maple Real Estate Llc
Bought by
Vazquez Adriana
Current Estimated Value
Purchase Details
Closed on
Jul 17, 2018
Sold by
County Of Cook
Bought by
Maple Real Estate Llc
Purchase Details
Closed on
Sep 10, 1999
Sold by
Rozdzynski Tomasz and Rozdzynski Adriana N
Bought by
Wilkins Mattie
Purchase Details
Closed on
Mar 22, 1999
Sold by
Rozdzynski Zbigniew H and Nenadich Bozena
Bought by
Rozdzynski Tomasz and Rozdzynski Adriana N
Purchase Details
Closed on
Sep 17, 1997
Sold by
Standard Bank & Trust Company
Bought by
Rozdzynski Zbigniew and Nenadich Bozena
Home Financials for this Owner
Home Financials are based on the most recent Mortgage that was taken out on this home.
Original Mortgage
$54,000
Interest Rate
7.54%
Create a Home Valuation Report for This Property
The Home Valuation Report is an in-depth analysis detailing your home's value as well as a comparison with similar homes in the area
Home Values in the Area
Average Home Value in this Area
Purchase History
| Date | Buyer | Sale Price | Title Company |
|---|---|---|---|
| Vazquez Adriana | $51,000 | Chicago Title | |
| Maple Real Estate Llc | -- | Attorney | |
| Wilkins Mattie | $75,000 | -- | |
| Rozdzynski Tomasz | -- | -- | |
| Rozdzynski Zbigniew | $45,000 | -- |
Source: Public Records
Mortgage History
| Date | Status | Borrower | Loan Amount |
|---|---|---|---|
| Previous Owner | Rozdzynski Zbigniew | $54,000 |
Source: Public Records
Tax History
| Year | Tax Paid | Tax Assessment Tax Assessment Total Assessment is a certain percentage of the fair market value that is determined by local assessors to be the total taxable value of land and additions on the property. | Land | Improvement |
|---|---|---|---|---|
| 2025 | $954 | $5,759 | $1,361 | $4,398 |
| 2024 | $954 | $5,759 | $1,361 | $4,398 |
| 2023 | $931 | $4,500 | $1,701 | $2,799 |
| 2022 | $931 | $4,500 | $1,701 | $2,799 |
| 2021 | $905 | $4,499 | $1,701 | $2,798 |
| 2020 | $1,222 | $5,451 | $1,701 | $3,750 |
| 2019 | $547 | $6,135 | $1,701 | $4,434 |
| 2018 | $842 | $7,668 | $1,701 | $5,967 |
| 2017 | $847 | $7,286 | $1,474 | $5,812 |
| 2016 | $965 | $7,286 | $1,474 | $5,812 |
| 2015 | $861 | $7,286 | $1,474 | $5,812 |
| 2014 | $710 | $6,367 | $1,361 | $5,006 |
| 2013 | $685 | $6,367 | $1,361 | $5,006 |
Source: Public Records
Map
Nearby Homes
- 4350 W Ford City Dr Unit B1402
- 4350 W Ford City Dr Unit B1104
- 4300 W Ford City Dr Unit 401A
- 4300 W Ford City Dr Unit A708
- 4300 W Ford City Dr Unit A503
- 7715 S Kilpatrick Ave
- 7731 S Keating Ave
- 7900 S Kilpatrick Ave
- 7964 S Tripp Ave
- 3908 W 76th Place
- 7958 S Knox Ave
- 8017 S Kostner Ave
- 3832 W 77th Place
- 4263 W 81st St
- 4410 W 81st Place
- 8132 S Kilbourn Ave
- 8020 S Pulaski Rd Unit 3W
- 8169 S Tripp Ave
- 4131 W 81st Place
- 3754 W 76th St
- 4351 W 76th St Unit 501
- 4351 W 76th St Unit 204
- 4351 W 76th St Unit 302
- 4351 W 76th St Unit 304
- 4351 W 76th St Unit 105
- 4351 W 76th St Unit C1202
- 4351 W 76th St Unit C1307
- 4351 W 76th St Unit C1206
- 4351 W 76th St Unit C1103
- 4351 W 76th St Unit C1408
- 4351 W 76th St Unit C1404
- 4351 W 76th St Unit C1401
- 4351 W 76th St Unit C1405
- 4351 W 76th St Unit C1207
- 4351 W 76th St Unit C1305
- 4351 W 76th St Unit C1303
- 4351 W 76th St Unit C1205
- 4351 W 76th St Unit C1403
- 4351 W 76th St Unit C1502
- 4351 W 76th St Unit C1506
Your Personal Tour Guide
Ask me questions while you tour the home.