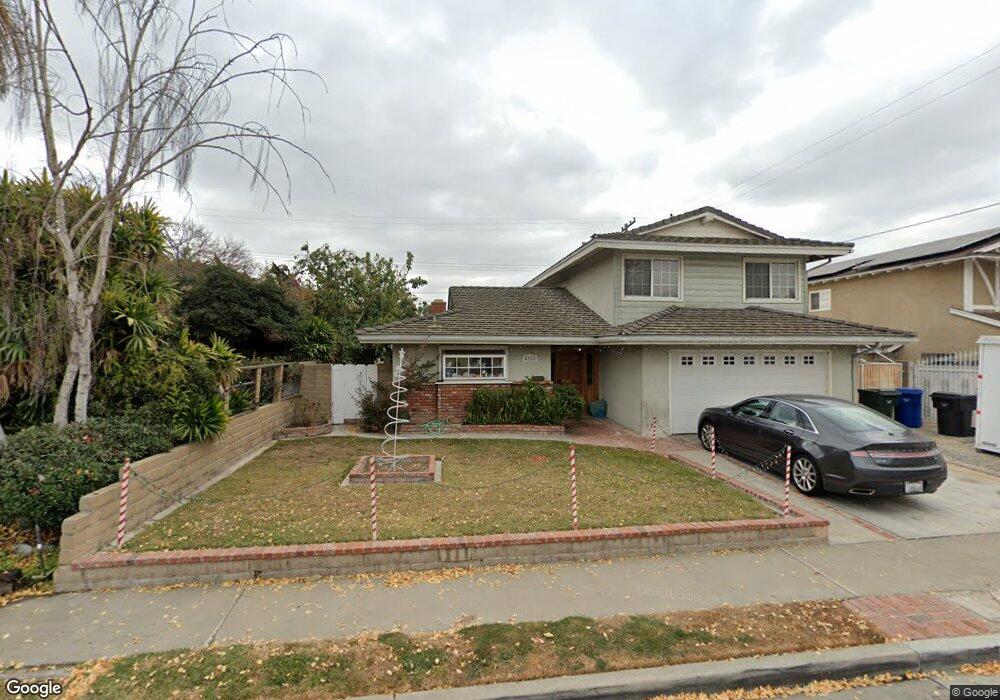
4352 Opal Ave Cypress, CA 90630
Estimated Value: $1,059,000 - $1,204,000
5
Beds
2
Baths
1,824
Sq Ft
$612/Sq Ft
Est. Value
About This Home
This home is located at 4352 Opal Ave, Cypress, CA 90630 and is currently estimated at $1,116,826, approximately $612 per square foot. 4352 Opal Ave is a home located in Orange County with nearby schools including Steve Luther Elementary School, Walker Junior High School, and John F. Kennedy High School.
Ownership History
Date
Name
Owned For
Owner Type
Purchase Details
Closed on
Oct 31, 1997
Sold by
Bankers Trust Company
Bought by
Cory Richard J and Cory Annetta G
Current Estimated Value
Home Financials for this Owner
Home Financials are based on the most recent Mortgage that was taken out on this home.
Original Mortgage
$171,900
Outstanding Balance
$37,692
Interest Rate
10.99%
Estimated Equity
$1,079,134
Purchase Details
Closed on
Sep 2, 1997
Sold by
Kenneth Giles and Kenneth Dianne V
Bought by
Bankers Trust Company
Home Financials for this Owner
Home Financials are based on the most recent Mortgage that was taken out on this home.
Original Mortgage
$171,900
Outstanding Balance
$37,692
Interest Rate
10.99%
Estimated Equity
$1,079,134
Purchase Details
Closed on
Feb 16, 1993
Sold by
Department Of Veterans Affairs
Bought by
Giles Kenneth and Giles Dianne
Home Financials for this Owner
Home Financials are based on the most recent Mortgage that was taken out on this home.
Original Mortgage
$163,100
Interest Rate
7.74%
Create a Home Valuation Report for This Property
The Home Valuation Report is an in-depth analysis detailing your home's value as well as a comparison with similar homes in the area
Home Values in the Area
Average Home Value in this Area
Purchase History
| Date | Buyer | Sale Price | Title Company |
|---|---|---|---|
| Cory Richard J | $191,000 | First Southwestern Title Co | |
| Bankers Trust Company | $176,269 | -- | |
| Giles Kenneth | -- | Continental Lawyers Title Co |
Source: Public Records
Mortgage History
| Date | Status | Borrower | Loan Amount |
|---|---|---|---|
| Open | Cory Richard J | $171,900 | |
| Previous Owner | Giles Kenneth | $163,100 |
Source: Public Records
Tax History
| Year | Tax Paid | Tax Assessment Tax Assessment Total Assessment is a certain percentage of the fair market value that is determined by local assessors to be the total taxable value of land and additions on the property. | Land | Improvement |
|---|---|---|---|---|
| 2025 | $3,638 | $304,966 | $181,864 | $123,102 |
| 2024 | $3,638 | $298,987 | $178,298 | $120,689 |
| 2023 | $3,554 | $293,125 | $174,802 | $118,323 |
| 2022 | $3,510 | $287,378 | $171,375 | $116,003 |
| 2021 | $3,464 | $281,744 | $168,015 | $113,729 |
| 2020 | $3,450 | $278,856 | $166,293 | $112,563 |
| 2019 | $3,357 | $273,389 | $163,033 | $110,356 |
| 2018 | $3,313 | $268,029 | $159,836 | $108,193 |
| 2017 | $3,203 | $262,774 | $156,702 | $106,072 |
| 2016 | $3,176 | $257,622 | $153,629 | $103,993 |
| 2015 | $3,152 | $253,753 | $151,322 | $102,431 |
| 2014 | $2,989 | $248,783 | $148,358 | $100,425 |
Source: Public Records
Map
Nearby Homes
- 12750 Centralia St Unit 76
- 4282 Crystal Cir
- 8326 Fontainbleau Way
- 8342 Fontainbleau Way
- 21108 Wilder Ave
- 12526 Chadwell St
- 8032 Lancashire Cir
- 4891 Grace Ave
- 4932 Windsong Ave
- 8689 Moody St
- 8762 La Salle St
- 20802 Ely Ave
- 8521 Via Tina
- 9080 Bloomfield Ave
- 9080 Bloomfield Ave
- 9080 Bloomfield Ave Unit 257
- 9080 Bloomfield Ave Unit 223
- 9080 Bloomfield Ave Unit 255
- 9080 Bloomfield Ave Unit 108
- 9080 Bloomfield Ave Unit 31
Your Personal Tour Guide
Ask me questions while you tour the home.