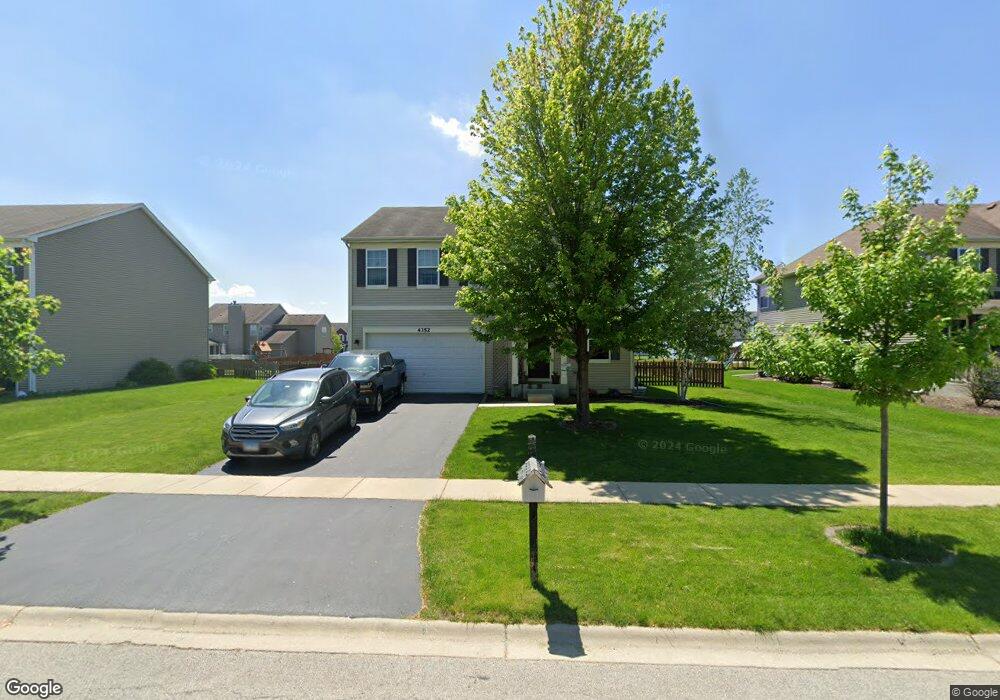
4352 Shofield Dr Oswego, IL 60543
South Oswego NeighborhoodEstimated Value: $358,000 - $432,000
3
Beds
3
Baths
2,252
Sq Ft
$182/Sq Ft
Est. Value
About This Home
This home is located at 4352 Shofield Dr, Oswego, IL 60543 and is currently estimated at $409,976, approximately $182 per square foot. 4352 Shofield Dr is a home located in Kendall County with nearby schools including Hunt Club Elementary School, Traughber Junior High School, and Oswego High School.
Ownership History
Date
Name
Owned For
Owner Type
Purchase Details
Closed on
Nov 6, 2018
Sold by
Wydra Matthew R and Wydra Amanda L
Bought by
Lilly Marie and Marie Lilly Living Trust
Current Estimated Value
Purchase Details
Closed on
Apr 18, 2015
Sold by
Ruby Michael Allea and Ruby Amanda Kidd
Bought by
Wydra Matthew R and Wydra Amanda L
Home Financials for this Owner
Home Financials are based on the most recent Mortgage that was taken out on this home.
Original Mortgage
$179,600
Interest Rate
3.77%
Mortgage Type
New Conventional
Purchase Details
Closed on
Dec 22, 2011
Sold by
Hovsite Hunt Club L L C
Bought by
Ruby Michael Allen and Ruby Amanda Kidd
Home Financials for this Owner
Home Financials are based on the most recent Mortgage that was taken out on this home.
Original Mortgage
$190,100
Interest Rate
3.99%
Mortgage Type
New Conventional
Create a Home Valuation Report for This Property
The Home Valuation Report is an in-depth analysis detailing your home's value as well as a comparison with similar homes in the area
Home Values in the Area
Average Home Value in this Area
Purchase History
| Date | Buyer | Sale Price | Title Company |
|---|---|---|---|
| Lilly Marie | $260,000 | Wheatland Title Guaranty | |
| Wydra Matthew R | $224,500 | Fidelity Natl Title Ins Co | |
| Ruby Michael Allen | $205,500 | Chicago Title Insurance Co |
Source: Public Records
Mortgage History
| Date | Status | Borrower | Loan Amount |
|---|---|---|---|
| Previous Owner | Wydra Matthew R | $179,600 | |
| Previous Owner | Ruby Michael Allen | $190,100 |
Source: Public Records
Tax History
| Year | Tax Paid | Tax Assessment Tax Assessment Total Assessment is a certain percentage of the fair market value that is determined by local assessors to be the total taxable value of land and additions on the property. | Land | Improvement |
|---|---|---|---|---|
| 2024 | $9,090 | $112,954 | $28,538 | $84,416 |
| 2023 | $8,207 | $99,959 | $25,255 | $74,704 |
| 2022 | $8,207 | $90,872 | $22,959 | $67,913 |
| 2021 | $7,948 | $84,927 | $21,457 | $63,470 |
| 2020 | $8,026 | $84,927 | $21,457 | $63,470 |
| 2019 | $7,400 | $83,079 | $21,457 | $61,622 |
| 2018 | $7,526 | $83,079 | $21,457 | $61,622 |
| 2017 | $7,346 | $77,644 | $20,053 | $57,591 |
| 2016 | $7,031 | $73,597 | $19,008 | $54,589 |
| 2015 | $6,919 | $69,431 | $17,932 | $51,499 |
| 2014 | -- | $69,431 | $17,932 | $51,499 |
| 2013 | -- | $69,431 | $17,932 | $51,499 |
Source: Public Records
Map
Nearby Homes
- 4215 Southerland Dr
- 4700 Laughton Ave
- 539 Sudbury Cir
- 5021 Minkler Rd
- 5500 Half Hollow Ct
- 68 Oak Creek Dr
- 51 Crestview Dr
- 55 Oak Creek Dr
- 53 Abbeyfeale Dr
- 291 Morgan Valley Dr
- 482 Deerfield Dr
- 483 Deerfield Dr
- 514 Danbury Dr Unit 4
- 509 Marty Ln
- 676 Cumberland Ln
- 668 Cumberland Ln
- 135 Country Ln
- 673 Cumberland Ln
- 770 Dartmouth Ln
- 777 Dartmouth Ln
- 4354 Schofield Dr
- 4352 Schofield Dr
- 4354 Shofield Dr
- 4350 Shofield Dr
- 4350 Schofield Dr
- 4657 Mclaren Dr
- 4356 Shofield Dr
- 4659 Mclaren Dr
- 4348 Schofield Dr
- 4348 Shofield Dr
- 4655 Mclaren Dr
- 4661 Mclaren Dr
- 4353 Schofield Dr
- 4351 Shofield Dr
- 4351 Schofield Dr
- 4353 Shofield Dr
- 4355 Schofield Dr
- 4349 Schofield Dr
- 4358 Schofield Dr
- 4346 Schofield Dr
Your Personal Tour Guide
Ask me questions while you tour the home.