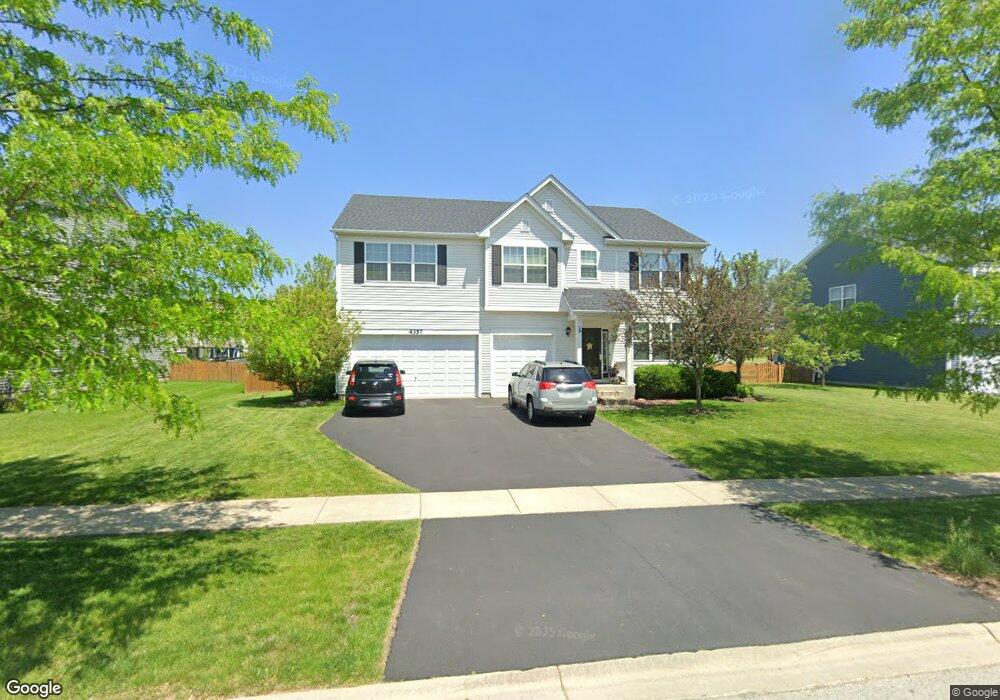
4357 Shofield Dr Oswego, IL 60543
South Oswego NeighborhoodEstimated Value: $491,000 - $511,000
4
Beds
3
Baths
3,238
Sq Ft
$155/Sq Ft
Est. Value
About This Home
This home is located at 4357 Shofield Dr, Oswego, IL 60543 and is currently estimated at $502,974, approximately $155 per square foot. 4357 Shofield Dr is a home located in Kendall County with nearby schools including Hunt Club Elementary School, Traughber Junior High School, and Oswego High School.
Ownership History
Date
Name
Owned For
Owner Type
Purchase Details
Closed on
Jan 24, 2025
Sold by
Cole Timothy J and Brucki Julie A
Bought by
Young Yu and Seonmi Shin Seonmi
Current Estimated Value
Home Financials for this Owner
Home Financials are based on the most recent Mortgage that was taken out on this home.
Original Mortgage
$325,000
Outstanding Balance
$322,906
Interest Rate
6.49%
Mortgage Type
New Conventional
Estimated Equity
$180,068
Purchase Details
Closed on
Oct 17, 2017
Sold by
Hutchens Andrew W and Hutchens Johnna
Bought by
Cole Timothy J and Brucki Julie A
Home Financials for this Owner
Home Financials are based on the most recent Mortgage that was taken out on this home.
Original Mortgage
$289,750
Interest Rate
3.78%
Mortgage Type
New Conventional
Purchase Details
Closed on
Nov 21, 2011
Sold by
Hovsite Hunt Club L L C
Bought by
Hutchens Andrew W and Hutchens Johnna
Home Financials for this Owner
Home Financials are based on the most recent Mortgage that was taken out on this home.
Original Mortgage
$235,800
Interest Rate
4.12%
Mortgage Type
New Conventional
Create a Home Valuation Report for This Property
The Home Valuation Report is an in-depth analysis detailing your home's value as well as a comparison with similar homes in the area
Home Values in the Area
Average Home Value in this Area
Purchase History
| Date | Buyer | Sale Price | Title Company |
|---|---|---|---|
| Young Yu | $475,000 | Citywide Title | |
| Cole Timothy J | $305,000 | Near North National Title | |
| Hutchens Andrew W | $262,500 | Chicago Title Insurance Co |
Source: Public Records
Mortgage History
| Date | Status | Borrower | Loan Amount |
|---|---|---|---|
| Open | Young Yu | $325,000 | |
| Previous Owner | Cole Timothy J | $289,750 | |
| Previous Owner | Hutchens Andrew W | $235,800 |
Source: Public Records
Tax History
| Year | Tax Paid | Tax Assessment Tax Assessment Total Assessment is a certain percentage of the fair market value that is determined by local assessors to be the total taxable value of land and additions on the property. | Land | Improvement |
|---|---|---|---|---|
| 2024 | $11,265 | $145,985 | $28,538 | $117,447 |
| 2023 | $10,065 | $129,190 | $25,255 | $103,935 |
| 2022 | $10,065 | $117,445 | $22,959 | $94,486 |
| 2021 | $9,710 | $109,762 | $21,457 | $88,305 |
| 2020 | $9,806 | $109,762 | $21,457 | $88,305 |
| 2019 | $9,558 | $105,557 | $21,457 | $84,100 |
| 2018 | $9,726 | $105,557 | $21,457 | $84,100 |
| 2017 | $9,499 | $98,651 | $20,053 | $78,598 |
| 2016 | $9,102 | $93,508 | $19,008 | $74,500 |
| 2015 | $8,969 | $88,215 | $17,932 | $70,283 |
| 2014 | -- | $88,215 | $17,932 | $70,283 |
| 2013 | -- | $88,215 | $17,932 | $70,283 |
Source: Public Records
Map
Nearby Homes
- 4215 Southerland Dr
- 4700 Laughton Ave
- 539 Sudbury Cir
- 5021 Minkler Rd
- 5500 Half Hollow Ct
- 68 Oak Creek Dr
- 51 Crestview Dr
- 55 Oak Creek Dr
- 53 Abbeyfeale Dr
- 291 Morgan Valley Dr
- 482 Deerfield Dr
- 483 Deerfield Dr
- 514 Danbury Dr Unit 4
- 509 Marty Ln
- 676 Cumberland Ln
- 668 Cumberland Ln
- 135 Country Ln
- 673 Cumberland Ln
- 770 Dartmouth Ln
- 777 Dartmouth Ln
- 4357 Schofield Dr
- 4359 Schofield Dr
- 4355 Schofield Dr
- 4307 Shofield Dr
- 4038 Hunt Club Dr
- 4353 Shofield Dr
- 4040 Hunt Club Dr
- 4353 Schofield Dr
- 4358 Schofield Dr
- 4042 Hunt Club Dr
- 4036 Hunt Club Dr
- 4356 Shofield Dr
- 4844 Weaver-Lot139 St
- 4034 Hunt Club Dr
- 4354 Shofield Dr
- 4351 Shofield Dr
- 4351 Schofield Dr
- 4844 Weaver St
- 4846 Weaver St
- 4354 Schofield Dr
Your Personal Tour Guide
Ask me questions while you tour the home.