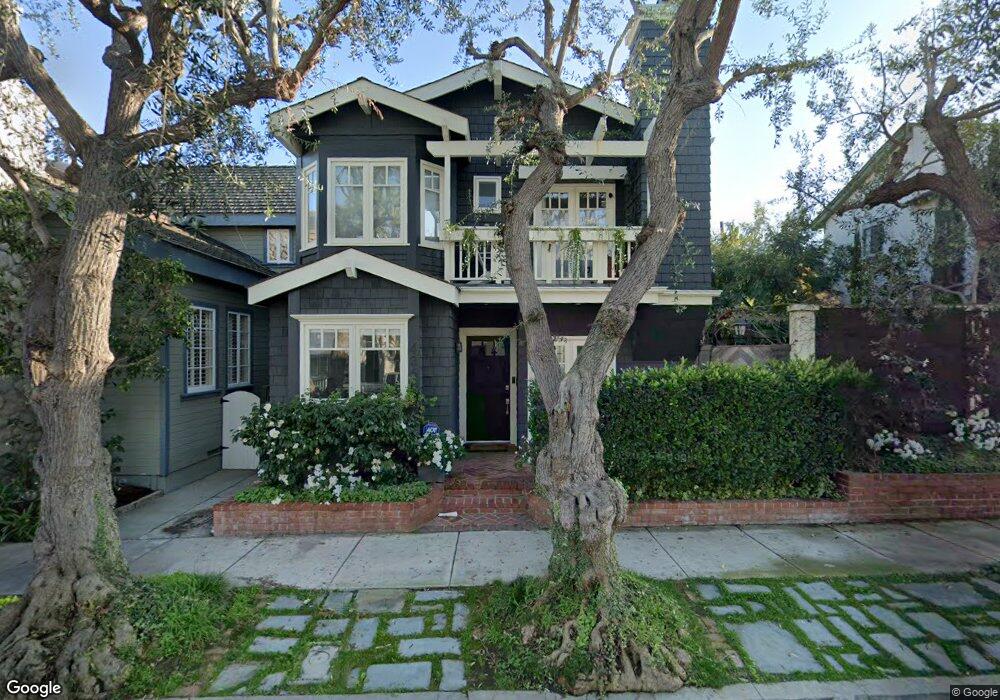
436 3rd St Manhattan Beach, CA 90266
Estimated Value: $4,178,886 - $5,091,000
4
Beds
4
Baths
3,191
Sq Ft
$1,420/Sq Ft
Est. Value
About This Home
This home is located at 436 3rd St, Manhattan Beach, CA 90266 and is currently estimated at $4,530,722, approximately $1,419 per square foot. 436 3rd St is a home located in Los Angeles County with nearby schools including Opal Robinson Elementary School, Manhattan Beach Middle School, and Mira Costa High School.
Ownership History
Date
Name
Owned For
Owner Type
Purchase Details
Closed on
Apr 18, 2013
Sold by
Hacohen Ron
Bought by
Hacohen Ron D and Hacohen Abby
Current Estimated Value
Home Financials for this Owner
Home Financials are based on the most recent Mortgage that was taken out on this home.
Original Mortgage
$547,000
Outstanding Balance
$387,329
Interest Rate
3.54%
Mortgage Type
New Conventional
Estimated Equity
$4,143,393
Purchase Details
Closed on
Jun 25, 2012
Sold by
Hacohen Ron and Hacohen Abby
Bought by
Hacohen Ron D and Hacohen Abby
Home Financials for this Owner
Home Financials are based on the most recent Mortgage that was taken out on this home.
Original Mortgage
$553,000
Interest Rate
3.62%
Mortgage Type
New Conventional
Purchase Details
Closed on
Jan 25, 2012
Sold by
Hacohen Ron and Hacohen Abby
Bought by
Hacohen Ron D and Hacohen Abby
Home Financials for this Owner
Home Financials are based on the most recent Mortgage that was taken out on this home.
Original Mortgage
$555,000
Interest Rate
3.86%
Mortgage Type
New Conventional
Purchase Details
Closed on
Nov 23, 2009
Sold by
Hacohen Ron and Hacohen Abby
Bought by
Hacohen Ron D
Home Financials for this Owner
Home Financials are based on the most recent Mortgage that was taken out on this home.
Original Mortgage
$573,000
Interest Rate
4.88%
Mortgage Type
New Conventional
Purchase Details
Closed on
Nov 9, 2001
Sold by
Hacohen Ron and Hacohen Abby
Bought by
Hacohen Ron D
Purchase Details
Closed on
Dec 31, 1997
Sold by
Woodcock Michael and Woodcock Helen B
Bought by
Hacohen Ron
Home Financials for this Owner
Home Financials are based on the most recent Mortgage that was taken out on this home.
Original Mortgage
$650,000
Interest Rate
7.14%
Purchase Details
Closed on
May 10, 1995
Sold by
Boulware James Edward and Boulware Nancy Gayle
Bought by
Woodcock Michael
Home Financials for this Owner
Home Financials are based on the most recent Mortgage that was taken out on this home.
Original Mortgage
$345,538
Interest Rate
8.32%
Mortgage Type
Seller Take Back
Create a Home Valuation Report for This Property
The Home Valuation Report is an in-depth analysis detailing your home's value as well as a comparison with similar homes in the area
Home Values in the Area
Average Home Value in this Area
Purchase History
| Date | Buyer | Sale Price | Title Company |
|---|---|---|---|
| Hacohen Ron D | -- | Nations Title Company Of Ca | |
| Hacohen Ron | -- | Nations Title Company Of Ca | |
| Hacohen Ron D | -- | Accommodation | |
| Hacohen Ron | -- | Equity Title Orange County-I | |
| Hacohen Ron D | -- | Accommodation | |
| Hacohen Ron | -- | Equity Title Orange County-I | |
| Hacohen Ron D | -- | None Available | |
| Hacohen Ron | -- | Fidelity National Title Co | |
| Hacohen Ron D | -- | -- | |
| Hacohen Ron | $865,000 | -- | |
| Woodcock Michael | $45,000 | Continental Lawyers Title Co |
Source: Public Records
Mortgage History
| Date | Status | Borrower | Loan Amount |
|---|---|---|---|
| Open | Hacohen Ron | $547,000 | |
| Closed | Hacohen Ron | $553,000 | |
| Closed | Hacohen Ron | $555,000 | |
| Closed | Hacohen Ron | $573,000 | |
| Closed | Hacohen Ron | $650,000 | |
| Previous Owner | Woodcock Michael | $345,538 |
Source: Public Records
Tax History
| Year | Tax Paid | Tax Assessment Tax Assessment Total Assessment is a certain percentage of the fair market value that is determined by local assessors to be the total taxable value of land and additions on the property. | Land | Improvement |
|---|---|---|---|---|
| 2025 | $15,771 | $1,381,186 | $894,184 | $487,002 |
| 2024 | $15,771 | $1,354,104 | $876,651 | $477,453 |
| 2023 | $15,336 | $1,327,554 | $859,462 | $468,092 |
| 2022 | $15,073 | $1,301,524 | $842,610 | $458,914 |
| 2021 | $14,828 | $1,276,005 | $826,089 | $449,916 |
| 2019 | $14,432 | $1,238,160 | $801,588 | $436,572 |
| 2018 | $14,128 | $1,213,883 | $785,871 | $428,012 |
| 2016 | $13,041 | $1,166,748 | $755,355 | $411,393 |
| 2015 | $12,772 | $1,149,223 | $744,009 | $405,214 |
| 2014 | $12,596 | $1,126,712 | $729,435 | $397,277 |
Source: Public Records
Map
Nearby Homes
- 436 1st St
- 98 Highland Ave
- 621 6th St
- 89 Bayview Dr
- 121 35th St
- 109 S Poinsettia Ave
- 215 S Poinsettia Ave
- 231 Longfellow Ave
- 500 N Poinsettia Ave
- 921 Highland Ave
- 337 10th St
- 626 Longfellow Ave
- 920 The Strand
- 1000 The Strand
- 124 11th St
- 525 Manhattan Beach Blvd
- 720 Manhattan Beach Blvd
- 710 Manhattan Beach Blvd
- 1140 Fisher Ave
- 927 9th St
Your Personal Tour Guide
Ask me questions while you tour the home.