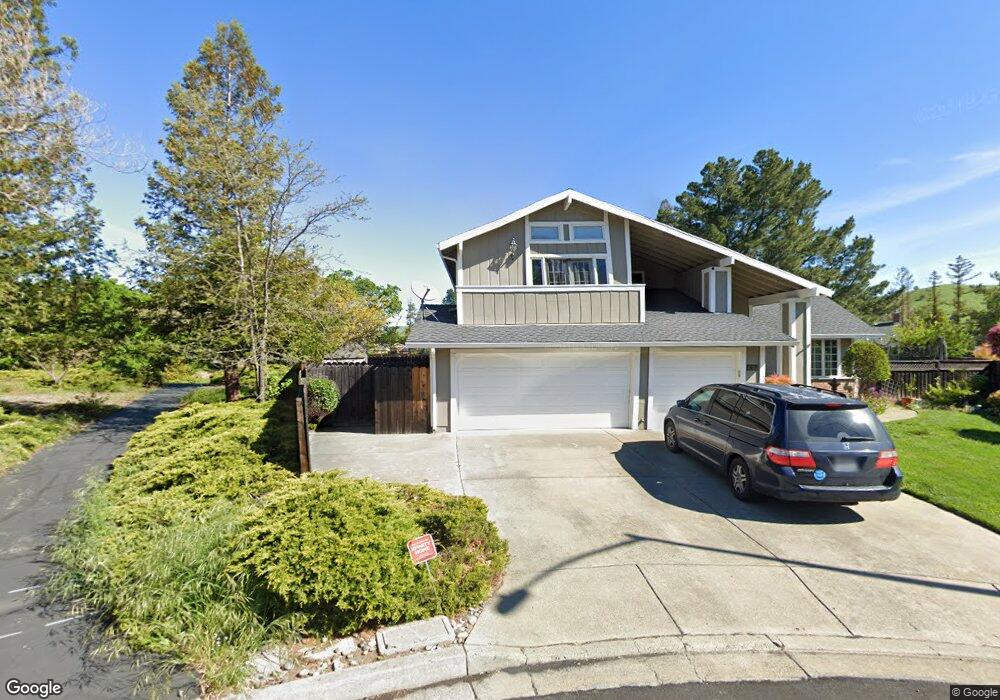
436 Mt Sequoia Ct Clayton, CA 94517
Estimated Value: $1,232,000 - $1,360,000
5
Beds
3
Baths
2,691
Sq Ft
$481/Sq Ft
Est. Value
About This Home
This home is located at 436 Mt Sequoia Ct, Clayton, CA 94517 and is currently estimated at $1,294,433, approximately $481 per square foot. 436 Mt Sequoia Ct is a home located in Contra Costa County with nearby schools including Mt. Diablo Elementary School, Diablo View Middle School, and College Park High School.
Ownership History
Date
Name
Owned For
Owner Type
Purchase Details
Closed on
Nov 24, 2020
Sold by
Arvizu Victor E and Arvizu Maria A
Bought by
Arvizu Family Trust and Arvizu
Current Estimated Value
Home Financials for this Owner
Home Financials are based on the most recent Mortgage that was taken out on this home.
Original Mortgage
$625,000
Outstanding Balance
$552,341
Interest Rate
2.8%
Mortgage Type
New Conventional
Estimated Equity
$742,092
Purchase Details
Closed on
May 19, 2017
Sold by
Arvizu Victor and Arvizu Maria
Bought by
Arvizu Victor E and Arvizu Maria A C
Home Financials for this Owner
Home Financials are based on the most recent Mortgage that was taken out on this home.
Original Mortgage
$590,000
Interest Rate
4.08%
Mortgage Type
New Conventional
Purchase Details
Closed on
May 23, 2011
Sold by
Tankersley Stanley A and Tankersley Yolanda A
Bought by
Arvizu Victor and Arvizu Maria
Home Financials for this Owner
Home Financials are based on the most recent Mortgage that was taken out on this home.
Original Mortgage
$628,649
Interest Rate
4.84%
Mortgage Type
FHA
Create a Home Valuation Report for This Property
The Home Valuation Report is an in-depth analysis detailing your home's value as well as a comparison with similar homes in the area
Home Values in the Area
Average Home Value in this Area
Purchase History
| Date | Buyer | Sale Price | Title Company |
|---|---|---|---|
| Arvizu Family Trust | -- | Wfg National Title | |
| Arvizu Victor E | -- | Wfg National Title | |
| Arvizu Victor E | -- | Chicago Title Company | |
| Arvizu Victor | $645,000 | First American Title Company |
Source: Public Records
Mortgage History
| Date | Status | Borrower | Loan Amount |
|---|---|---|---|
| Open | Arvizu Victor E | $625,000 | |
| Previous Owner | Arvizu Victor E | $590,000 | |
| Previous Owner | Arvizu Victor | $628,649 |
Source: Public Records
Tax History
| Year | Tax Paid | Tax Assessment Tax Assessment Total Assessment is a certain percentage of the fair market value that is determined by local assessors to be the total taxable value of land and additions on the property. | Land | Improvement |
|---|---|---|---|---|
| 2025 | $10,715 | $848,476 | $413,863 | $434,613 |
| 2024 | $10,454 | $831,841 | $405,749 | $426,092 |
| 2023 | $10,264 | $815,532 | $397,794 | $417,738 |
| 2022 | $10,134 | $799,543 | $389,995 | $409,548 |
| 2021 | $9,893 | $783,867 | $382,349 | $401,518 |
| 2019 | $9,706 | $760,618 | $371,009 | $389,609 |
| 2018 | $9,348 | $745,705 | $363,735 | $381,970 |
| 2017 | $9,048 | $731,084 | $356,603 | $374,481 |
| 2016 | $8,611 | $698,056 | $335,500 | $362,556 |
| 2015 | $8,528 | $687,572 | $330,461 | $357,111 |
| 2014 | $8,396 | $674,104 | $323,988 | $350,116 |
Source: Public Records
Map
Nearby Homes
- 186 Mt Wilson Way
- 510 Mt Davidson Ct
- 33 El Molino Dr
- 23 Capistrano Ct
- 218 Mountaire Cir
- 15 El Portal Ct
- 249 Stranahan Cir
- 5849 Mitchell Canyon Ct
- 5817 Mitchell Canyon Ct
- 5795 Lewis Way
- 1048 Panadero Ct
- 1383 Shell Ln
- 1000 Froyd Rd
- 5 Pardi Ln
- 5535 Merritt Dr
- 5565 Jasper Ct
- 5565 Banff Ct
- 1421 Lydia Ln
- 376 Blue Oak Ln
- 1394 El Camino Dr
- 432 Mt Sequoia Ct
- 204 Mountaire Pkwy
- 431 Mt Sequoia Ct
- 200 Mountaire Pkwy
- 208 Mountaire Pkwy
- 427 Mount Sequoia Ct
- 427 Mt Sequoia Ct
- 428 Mt Sequoia Ct
- 423 Mt Sequoia Ct
- 212 Mountaire Pkwy
- 424 Mt Sequoia Ct
- 419 Mt Sequoia Ct
- 203 Mountaire Pkwy
- 199 Mountaire Pkwy
- 207 Mountaire Pkwy
- 216 Mountaire Pkwy
- 211 Mountaire Pkwy
- 191 Mountaire Pkwy
- 420 Mt Sequoia Ct
- 415 Mt Sequoia Ct
Your Personal Tour Guide
Ask me questions while you tour the home.