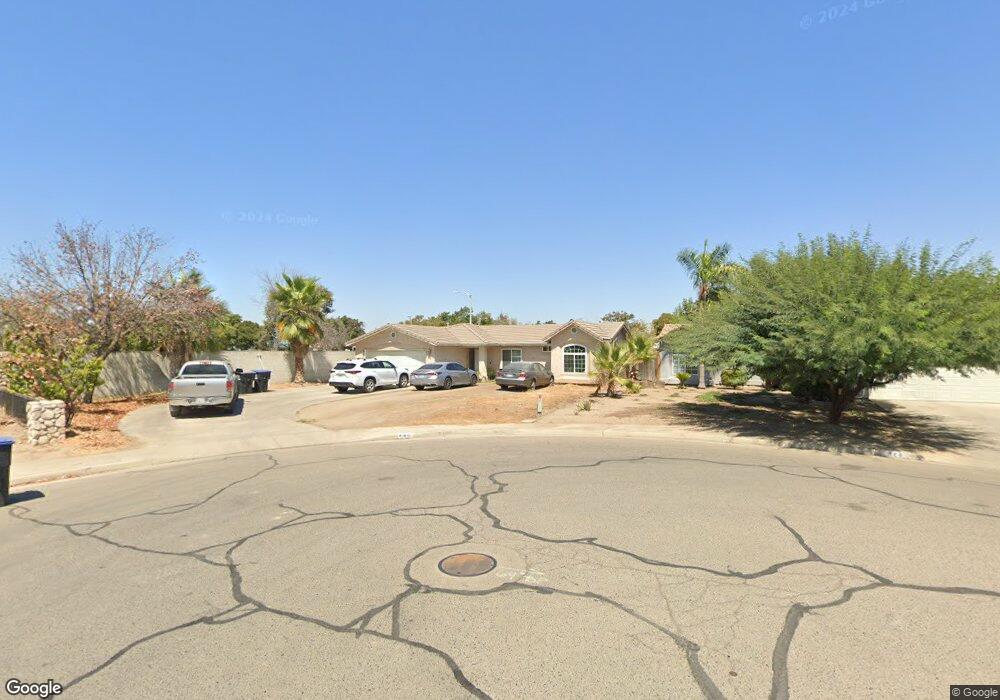
436 W Wren Ct Visalia, CA 93291
North Visalia NeighborhoodEstimated Value: $306,000 - $356,000
3
Beds
2
Baths
9,999
Sq Ft
$32/Sq Ft
Est. Value
About This Home
This home is located at 436 W Wren Ct, Visalia, CA 93291 and is currently estimated at $322,852, approximately $32 per square foot. 436 W Wren Ct is a home located in Tulare County with nearby schools including Crowley Elementary School, Divisadero Middle School, and Mt. Whitney High School.
Ownership History
Date
Name
Owned For
Owner Type
Purchase Details
Closed on
Feb 4, 2004
Sold by
Saesee Echou
Bought by
Saesee Chalee Mark and See Chansorn
Current Estimated Value
Purchase Details
Closed on
Jul 30, 2002
Sold by
Saesee Ai Saan
Bought by
Saesee Echou
Home Financials for this Owner
Home Financials are based on the most recent Mortgage that was taken out on this home.
Original Mortgage
$102,583
Interest Rate
6.6%
Mortgage Type
FHA
Purchase Details
Closed on
Jul 5, 2002
Sold by
Hud
Bought by
Saesee Chalee Mark and See Chansorn
Home Financials for this Owner
Home Financials are based on the most recent Mortgage that was taken out on this home.
Original Mortgage
$102,583
Interest Rate
6.6%
Mortgage Type
FHA
Purchase Details
Closed on
Feb 6, 2002
Sold by
Mortgage Electronic Registration Systems
Bought by
Hud
Purchase Details
Closed on
Mar 17, 1997
Sold by
Riverbend Investments
Bought by
Ferguson Daniel W and Ferguson Sonia G
Home Financials for this Owner
Home Financials are based on the most recent Mortgage that was taken out on this home.
Original Mortgage
$88,401
Interest Rate
7.86%
Mortgage Type
FHA
Create a Home Valuation Report for This Property
The Home Valuation Report is an in-depth analysis detailing your home's value as well as a comparison with similar homes in the area
Home Values in the Area
Average Home Value in this Area
Purchase History
| Date | Buyer | Sale Price | Title Company |
|---|---|---|---|
| Saesee Chalee Mark | -- | -- | |
| Saesee Echou | -- | -- | |
| Saesee Chalee Mark | $103,500 | -- | |
| Hud | -- | First American Title Co | |
| Ferguson Daniel W | $89,500 | Chicago Title Co |
Source: Public Records
Mortgage History
| Date | Status | Borrower | Loan Amount |
|---|---|---|---|
| Previous Owner | Saesee Chalee Mark | $102,583 | |
| Previous Owner | Ferguson Daniel W | $88,401 |
Source: Public Records
Tax History Compared to Growth
Tax History
| Year | Tax Paid | Tax Assessment Tax Assessment Total Assessment is a certain percentage of the fair market value that is determined by local assessors to be the total taxable value of land and additions on the property. | Land | Improvement |
|---|---|---|---|---|
| 2025 | $1,591 | $149,903 | $43,449 | $106,454 |
| 2024 | $1,591 | $146,965 | $42,598 | $104,367 |
| 2023 | $1,541 | $144,084 | $41,763 | $102,321 |
| 2022 | $1,474 | $141,260 | $40,945 | $100,315 |
| 2021 | $1,474 | $138,490 | $40,142 | $98,348 |
| 2020 | $1,451 | $137,070 | $39,730 | $97,340 |
| 2019 | $1,414 | $134,382 | $38,951 | $95,431 |
| 2018 | $1,369 | $131,747 | $38,187 | $93,560 |
| 2017 | $1,352 | $129,163 | $37,438 | $91,725 |
| 2016 | $1,323 | $126,630 | $36,704 | $89,926 |
| 2015 | $1,185 | $123,000 | $31,000 | $92,000 |
| 2014 | $1,185 | $113,000 | $28,000 | $85,000 |
Source: Public Records
Map
Nearby Homes
- 0 W Ferguson Ave Unit 214901
- 2418 N Jacob Ct
- 2341 N Jacob Ct
- 2948 N Church Ct
- 2344 N Turner Ct
- 1025 W Dove Dr
- 223 W Buena Vista Ave
- 143 E Sedona Ave
- 3310 N Church St
- 3325 N Church St
- 2746 N Giddings St
- 1322 W Prescott Ave Unit Lot3012
- 1322 W Prescott Ave
- 1030 W Prescott Ave
- 3336 N Moreno St
- 1635 N Dinuba Blvd
- 2146 N Bridge St
- The Buttercup Plan at Huckleberry Park
- The Sweet Pea Plan at Huckleberry Park
- The Juniper Plan at Huckleberry Park
- 428 W Wren Ct
- 416 W Wren Ct
- 435 W Glenhaven Ct
- 441 W Glenhaven Ct
- 437 W Wren Ct
- 404 W Wren Ct
- 427 W Glenhaven Ct Unit 148
- 427 W Glenhaven Ct
- 429 W Wren Ct
- 421 W Wren Ct
- 409 W Wren Ct
- 419 W Glenhaven Ct
- 340 W Wren Ave
- 3715 N Summers Ct
- 3625 N Summers Ct
- 3723 N Summers Ct
- 3741 N Summers Ct
- 3633 N Summers Ct
- 3707 N Summers Ct
- 403 W Wren Ct