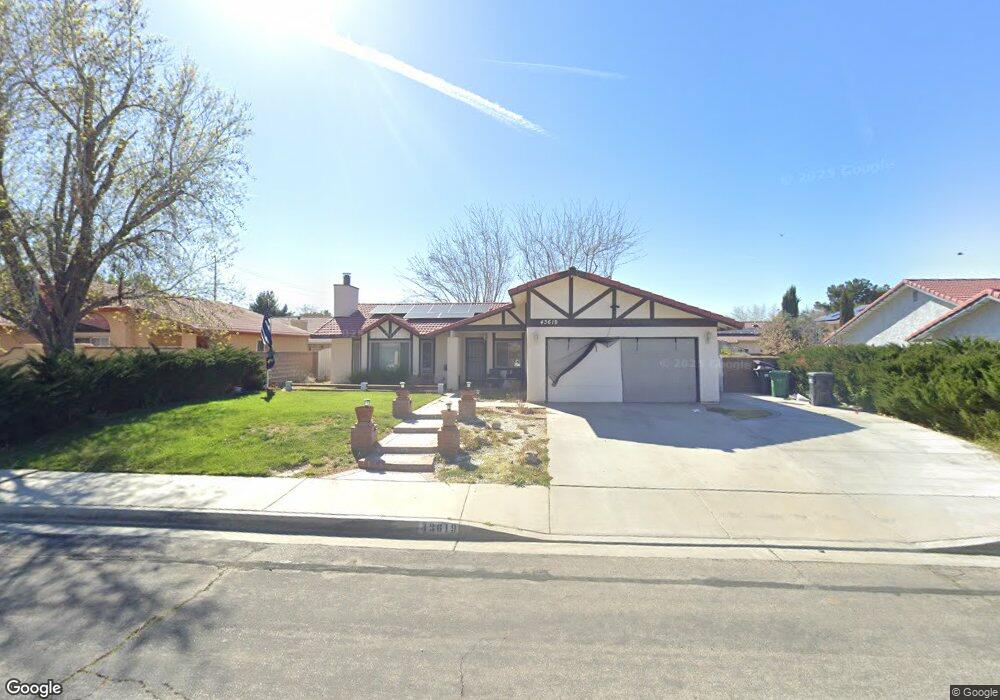
43619 Steif St Lancaster, CA 93535
East Lancaster NeighborhoodEstimated Value: $407,806 - $424,000
3
Beds
2
Baths
1,424
Sq Ft
$293/Sq Ft
Est. Value
About This Home
This home is located at 43619 Steif St, Lancaster, CA 93535 and is currently estimated at $416,702, approximately $292 per square foot. 43619 Steif St is a home located in Los Angeles County with nearby schools including Lincoln Elementary School, New Vista Middle School, and Eastside High School.
Ownership History
Date
Name
Owned For
Owner Type
Purchase Details
Closed on
Oct 27, 2011
Sold by
Lmr Properties Llc
Bought by
Modell David William
Current Estimated Value
Home Financials for this Owner
Home Financials are based on the most recent Mortgage that was taken out on this home.
Original Mortgage
$116,496
Outstanding Balance
$79,592
Interest Rate
4.06%
Mortgage Type
VA
Estimated Equity
$337,110
Purchase Details
Closed on
Aug 8, 2011
Sold by
Uribe Miriam A and Uribe Jose Luis
Bought by
Imr Properties Llc
Purchase Details
Closed on
Mar 30, 2004
Sold by
Wilson Anna Mangini
Bought by
Uribe Jose Luis
Home Financials for this Owner
Home Financials are based on the most recent Mortgage that was taken out on this home.
Original Mortgage
$160,000
Interest Rate
5.99%
Mortgage Type
Purchase Money Mortgage
Create a Home Valuation Report for This Property
The Home Valuation Report is an in-depth analysis detailing your home's value as well as a comparison with similar homes in the area
Home Values in the Area
Average Home Value in this Area
Purchase History
| Date | Buyer | Sale Price | Title Company |
|---|---|---|---|
| Modell David William | $115,000 | Stewart Title Of California | |
| Imr Properties Llc | -- | Cr Title Services Inc | |
| Uribe Jose Luis | $200,000 | Ticor Title Co Glendale |
Source: Public Records
Mortgage History
| Date | Status | Borrower | Loan Amount |
|---|---|---|---|
| Open | Modell David William | $116,496 | |
| Previous Owner | Uribe Jose Luis | $160,000 | |
| Closed | Uribe Jose Luis | $40,000 |
Source: Public Records
Tax History
| Year | Tax Paid | Tax Assessment Tax Assessment Total Assessment is a certain percentage of the fair market value that is determined by local assessors to be the total taxable value of land and additions on the property. | Land | Improvement |
|---|---|---|---|---|
| 2025 | $3,083 | $144,307 | $28,882 | $115,425 |
| 2024 | $3,083 | $141,478 | $28,316 | $113,162 |
| 2023 | $3,021 | $138,705 | $27,761 | $110,944 |
| 2022 | $2,837 | $135,986 | $27,217 | $108,769 |
| 2021 | $2,456 | $133,321 | $26,684 | $106,637 |
| 2019 | $2,392 | $129,369 | $25,894 | $103,475 |
| 2018 | $2,351 | $126,834 | $25,387 | $101,447 |
| 2016 | $2,234 | $121,910 | $24,402 | $97,508 |
| 2015 | $2,208 | $120,080 | $24,036 | $96,044 |
| 2014 | $2,208 | $117,729 | $23,566 | $94,163 |
Source: Public Records
Map
Nearby Homes
- 1518 E Avenue J-12
- 1518 E Avenue j12
- 1616 Thomas Dr
- 87 E Avenue J 12
- 117 E Avenue J 12
- 1350 Lincoln Ave
- 1642 Bisbee Place
- 1335 Samra Ave
- 43815 Silver Bow Rd
- 1565 Astoria Ave
- 1848 Trudgeon Ave
- 43922 Fallon Dr
- 43927 Fallon Dr
- 43646 Rembrandt St
- 43629 Rembrandt St
- 43929 Amy Ct
- 1820 E Avenue J 10
- 43964 Fallon Dr
- 43742 Rialto Dr
- 43635 Castle Cir
- 43627 Steif St
- 43611 Steif St
- 43618 16th St E
- 43624 16th St E
- 43635 Steif St
- 43603 Steif St
- 1618 Lauterbach St
- 43608 Steif St
- 43632 16th St E
- 43643 Steif St
- 1625 E Avenue K
- 1626 Lauterbach St
- 1617 Lauterbach St
- 43638 16th St E
- 43619 16th St E
- 1631 E Avenue K
- 43611 16th St E
- 43625 16th St E
- 1625 Lauterbach St
- 43651 Steif St
Your Personal Tour Guide
Ask me questions while you tour the home.