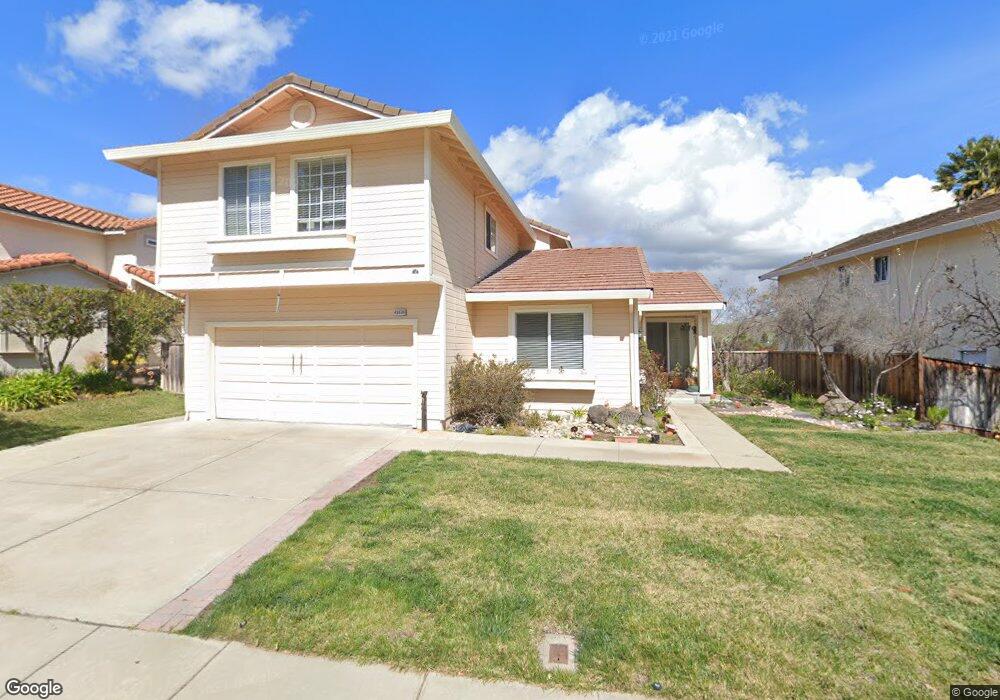
43639 Skye Rd Fremont, CA 94539
Weibel NeighborhoodEstimated Value: $2,510,705 - $2,789,000
4
Beds
3
Baths
1,914
Sq Ft
$1,372/Sq Ft
Est. Value
About This Home
This home is located at 43639 Skye Rd, Fremont, CA 94539 and is currently estimated at $2,626,676, approximately $1,372 per square foot. 43639 Skye Rd is a home located in Alameda County with nearby schools including Mission Valley Elementary School, William Hopkins Junior High School, and Mission San Jose High School.
Ownership History
Date
Name
Owned For
Owner Type
Purchase Details
Closed on
Aug 25, 2010
Sold by
Cuddalore Balasubramanian C and Cuddalore Kavitha B
Bought by
Cuddalore Balasubramanian C and Cuddalore Kavitha B
Current Estimated Value
Home Financials for this Owner
Home Financials are based on the most recent Mortgage that was taken out on this home.
Original Mortgage
$385,000
Outstanding Balance
$130,809
Interest Rate
4.52%
Mortgage Type
New Conventional
Estimated Equity
$2,495,867
Purchase Details
Closed on
Dec 29, 1998
Sold by
Zandi Mina
Bought by
Cuddalore Balasubraman and Cuddalore Kavitha
Home Financials for this Owner
Home Financials are based on the most recent Mortgage that was taken out on this home.
Original Mortgage
$382,400
Interest Rate
6.25%
Create a Home Valuation Report for This Property
The Home Valuation Report is an in-depth analysis detailing your home's value as well as a comparison with similar homes in the area
Home Values in the Area
Average Home Value in this Area
Purchase History
| Date | Buyer | Sale Price | Title Company |
|---|---|---|---|
| Cuddalore Balasubramanian C | -- | Old Republic Title Company | |
| Cuddalore Balasubraman | $478,000 | North American Title Co |
Source: Public Records
Mortgage History
| Date | Status | Borrower | Loan Amount |
|---|---|---|---|
| Open | Cuddalore Balasubramanian C | $385,000 | |
| Previous Owner | Cuddalore Balasubraman | $382,400 | |
| Closed | Cuddalore Balasubraman | $47,800 |
Source: Public Records
Tax History Compared to Growth
Tax History
| Year | Tax Paid | Tax Assessment Tax Assessment Total Assessment is a certain percentage of the fair market value that is determined by local assessors to be the total taxable value of land and additions on the property. | Land | Improvement |
|---|---|---|---|---|
| 2025 | $10,026 | $828,518 | $224,796 | $610,722 |
| 2024 | $10,026 | $812,140 | $220,390 | $598,750 |
| 2023 | $9,757 | $803,080 | $216,069 | $587,011 |
| 2022 | $9,629 | $780,336 | $211,833 | $575,503 |
| 2021 | $9,393 | $764,901 | $207,680 | $564,221 |
| 2020 | $9,417 | $763,986 | $205,550 | $558,436 |
| 2019 | $9,309 | $749,010 | $201,521 | $547,489 |
| 2018 | $9,127 | $734,325 | $197,570 | $536,755 |
| 2017 | $8,898 | $719,930 | $193,697 | $526,233 |
| 2016 | $8,746 | $705,816 | $189,900 | $515,916 |
| 2015 | $8,629 | $695,216 | $187,048 | $508,168 |
| 2014 | $8,480 | $681,598 | $183,384 | $498,214 |
Source: Public Records
Map
Nearby Homes
- 43555 Puesta Del Sol
- 646 Bella Vista Ct
- 2450 Euclid Place
- 905 Glenhill Dr
- 2164 Ocaso Camino
- 43580 Homestead Ct
- 483 Becado Place
- 379 Felipe Common
- 341 Dana St
- 43547 Ellsworth St
- 44520 Mesquite Ct
- 43382 Bryant St
- 42329 Troyer Ave
- 43150 Starr St
- 44423 View Point Cir
- 44916 Winding Ln
- 335 Via Rosario
- 42955 Corte Verde
- 2225 Valorie St
- 42965 Corte Verde