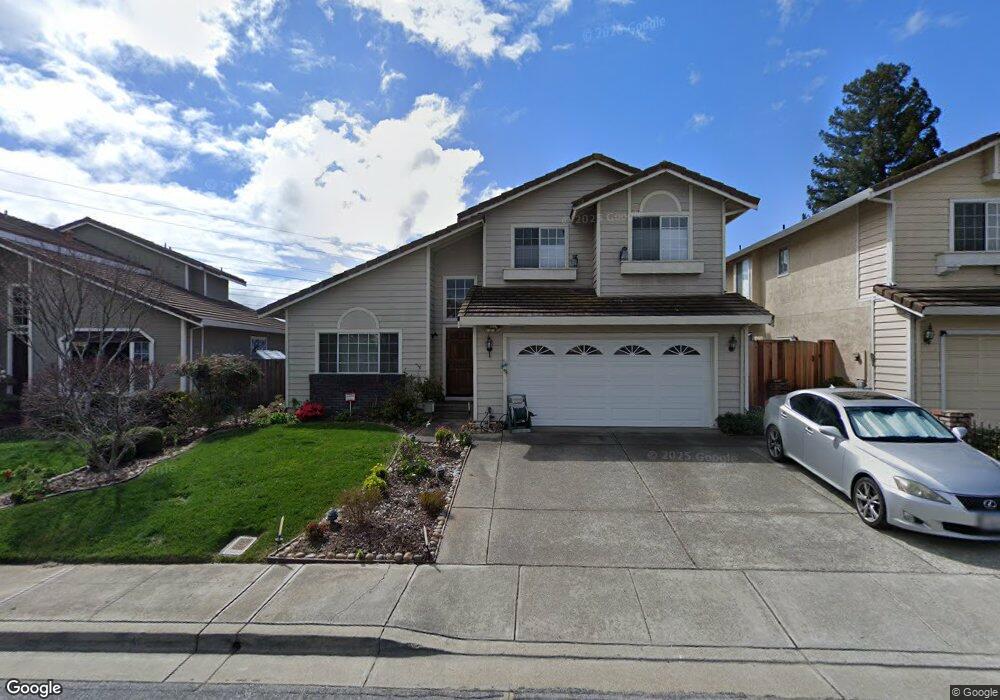
43643 Southerland Way Fremont, CA 94539
Weibel NeighborhoodEstimated Value: $2,162,000 - $2,679,000
3
Beds
3
Baths
2,139
Sq Ft
$1,148/Sq Ft
Est. Value
About This Home
This home is located at 43643 Southerland Way, Fremont, CA 94539 and is currently estimated at $2,456,098, approximately $1,148 per square foot. 43643 Southerland Way is a home located in Alameda County with nearby schools including Mission Valley Elementary School, William Hopkins Junior High School, and Mission San Jose High School.
Ownership History
Date
Name
Owned For
Owner Type
Purchase Details
Closed on
Mar 13, 2002
Sold by
Ho Samuel
Bought by
Ho Samuel and Ho Alisa Michelle
Current Estimated Value
Home Financials for this Owner
Home Financials are based on the most recent Mortgage that was taken out on this home.
Original Mortgage
$507,000
Outstanding Balance
$208,656
Interest Rate
6.85%
Estimated Equity
$2,247,442
Purchase Details
Closed on
Feb 25, 2000
Sold by
Pang Charles
Bought by
Ho Samuel
Home Financials for this Owner
Home Financials are based on the most recent Mortgage that was taken out on this home.
Original Mortgage
$499,950
Interest Rate
5.87%
Purchase Details
Closed on
Nov 20, 1997
Sold by
Smith Daniel T
Bought by
Pang Charles
Home Financials for this Owner
Home Financials are based on the most recent Mortgage that was taken out on this home.
Original Mortgage
$368,000
Interest Rate
7.12%
Purchase Details
Closed on
Oct 3, 1994
Sold by
Tahmineh Javadi Seyed Hossein and Tahmineh Ardjomandi
Bought by
Smith Daniel T
Home Financials for this Owner
Home Financials are based on the most recent Mortgage that was taken out on this home.
Original Mortgage
$316,000
Interest Rate
5.37%
Create a Home Valuation Report for This Property
The Home Valuation Report is an in-depth analysis detailing your home's value as well as a comparison with similar homes in the area
Home Values in the Area
Average Home Value in this Area
Purchase History
| Date | Buyer | Sale Price | Title Company |
|---|---|---|---|
| Ho Samuel | -- | Chicago Title Co | |
| Ho Samuel | $656,000 | American Title Co | |
| Pang Charles | $460,000 | North American Title Co | |
| Smith Daniel T | $395,000 | North American Title Company |
Source: Public Records
Mortgage History
| Date | Status | Borrower | Loan Amount |
|---|---|---|---|
| Open | Ho Samuel | $507,000 | |
| Closed | Ho Samuel | $499,950 | |
| Previous Owner | Pang Charles | $368,000 | |
| Previous Owner | Smith Daniel T | $316,000 |
Source: Public Records
Tax History Compared to Growth
Tax History
| Year | Tax Paid | Tax Assessment Tax Assessment Total Assessment is a certain percentage of the fair market value that is determined by local assessors to be the total taxable value of land and additions on the property. | Land | Improvement |
|---|---|---|---|---|
| 2025 | $11,935 | $1,000,431 | $302,306 | $705,125 |
| 2024 | $11,935 | $980,680 | $296,379 | $691,301 |
| 2023 | $11,619 | $968,317 | $290,569 | $677,748 |
| 2022 | $11,475 | $942,333 | $284,872 | $664,461 |
| 2021 | $11,191 | $923,724 | $279,288 | $651,436 |
| 2020 | $11,242 | $921,186 | $276,426 | $644,760 |
| 2019 | $11,112 | $903,127 | $271,007 | $632,120 |
| 2018 | $10,895 | $885,422 | $265,694 | $619,728 |
| 2017 | $10,622 | $868,064 | $260,485 | $607,579 |
| 2016 | $10,444 | $851,048 | $255,379 | $595,669 |
| 2015 | $10,309 | $838,265 | $251,543 | $586,722 |
| 2014 | $10,133 | $821,845 | $246,616 | $575,229 |
Source: Public Records
Map
Nearby Homes
- 43555 Puesta Del Sol
- 2450 Euclid Place
- 43580 Homestead Ct
- 2164 Ocaso Camino
- 646 Bella Vista Ct
- 636 Praderia Cir
- 905 Glenhill Dr
- 44520 Mesquite Ct
- 483 Becado Place
- 379 Felipe Common
- 44916 Winding Ln
- 341 Dana St
- 43547 Ellsworth St
- 42329 Troyer Ave
- 42759 Newport Dr
- 2225 Valorie St
- 2785 Washington Blvd
- 43150 Starr St
- 44423 View Point Cir
- 725 Little Foot Dr
- 43649 Southerland Way
- 43631 Southerland Way
- 43655 Southerland Way
- 43654 Southerland Way
- 43625 Southerland Way
- 43661 Southerland Way
- 43630 Southerland Way
- 43666 Southerland Way
- 43619 Southerland Way
- 1780 Firth Ct
- 43624 Southerland Way
- 43678 Southerland Way
- 1797 Firth Ct
- 43613 Southerland Way
- 43673 Southerland Way
- 43612 Southerland Way
- 1756 Firth Ct
- 1773 Firth Ct
- 43679 Southerland Way
- 43684 Southerland Way