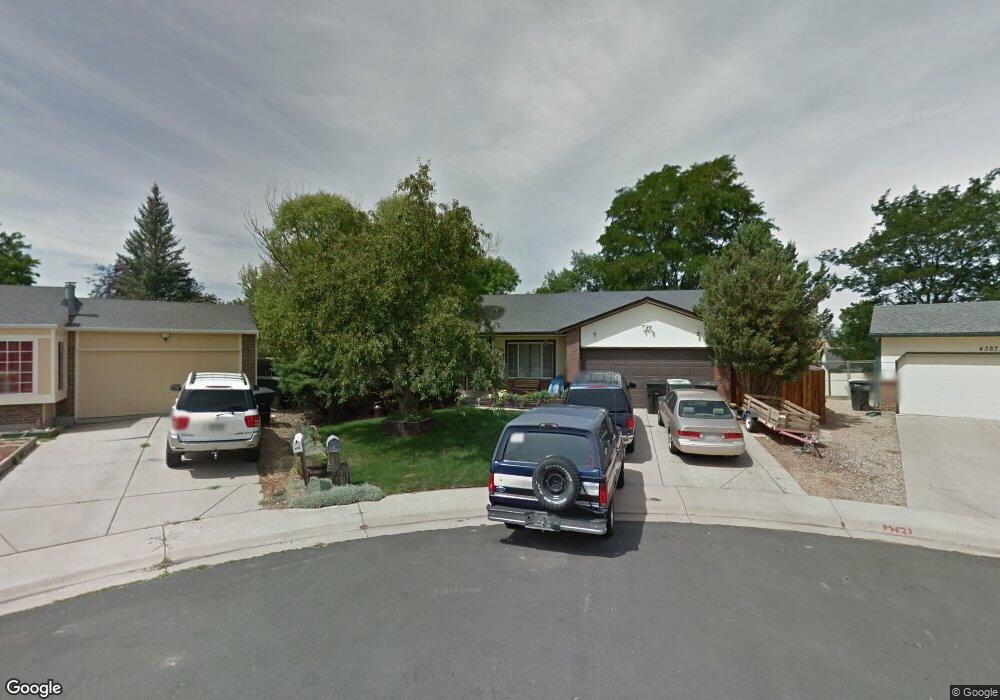
4366 E 118th Ct Thornton, CO 80233
Briar Ridge NeighborhoodEstimated Value: $429,928 - $505,000
3
Beds
2
Baths
1,344
Sq Ft
$348/Sq Ft
Est. Value
About This Home
This home is located at 4366 E 118th Ct, Thornton, CO 80233 and is currently estimated at $468,232, approximately $348 per square foot. 4366 E 118th Ct is a home located in Adams County with nearby schools including Cherry Drive Elementary School, Shadow Ridge Middle School, and Mountain Range High School.
Ownership History
Date
Name
Owned For
Owner Type
Purchase Details
Closed on
Jan 26, 2022
Sold by
Suchey Gregory M
Bought by
Suchey Cathy L
Current Estimated Value
Home Financials for this Owner
Home Financials are based on the most recent Mortgage that was taken out on this home.
Original Mortgage
$720,000
Outstanding Balance
$714,118
Interest Rate
3.56%
Mortgage Type
Reverse Mortgage Home Equity Conversion Mortgage
Estimated Equity
-$245,886
Purchase Details
Closed on
Mar 16, 1994
Sold by
Suchey Gregory M and Woodyard Cathy L
Bought by
Suchey Gregory M and Suchey Cathy L
Home Financials for this Owner
Home Financials are based on the most recent Mortgage that was taken out on this home.
Original Mortgage
$73,593
Interest Rate
7.31%
Mortgage Type
FHA
Purchase Details
Closed on
Jul 3, 1991
Create a Home Valuation Report for This Property
The Home Valuation Report is an in-depth analysis detailing your home's value as well as a comparison with similar homes in the area
Home Values in the Area
Average Home Value in this Area
Purchase History
| Date | Buyer | Sale Price | Title Company |
|---|---|---|---|
| Suchey Cathy L | -- | None Listed On Document | |
| Suchey Gregory M | -- | -- | |
| -- | $82,500 | -- |
Source: Public Records
Mortgage History
| Date | Status | Borrower | Loan Amount |
|---|---|---|---|
| Open | Suchey Cathy L | $720,000 | |
| Previous Owner | Suchey Gregory M | $73,593 |
Source: Public Records
Tax History
| Year | Tax Paid | Tax Assessment Tax Assessment Total Assessment is a certain percentage of the fair market value that is determined by local assessors to be the total taxable value of land and additions on the property. | Land | Improvement |
|---|---|---|---|---|
| 2025 | $2,353 | $31,490 | $6,600 | $24,890 |
| 2024 | $2,353 | $28,940 | $6,060 | $22,880 |
| 2023 | $2,330 | $33,220 | $6,090 | $27,130 |
| 2022 | $1,798 | $23,270 | $5,770 | $17,500 |
| 2021 | $1,857 | $23,270 | $5,770 | $17,500 |
| 2020 | $1,882 | $24,020 | $5,930 | $18,090 |
| 2019 | $1,886 | $24,020 | $5,930 | $18,090 |
| 2018 | $1,411 | $19,460 | $6,840 | $12,620 |
| 2017 | $1,283 | $19,460 | $6,840 | $12,620 |
| 2016 | $861 | $15,970 | $3,180 | $12,790 |
| 2015 | $860 | $8,010 | $1,600 | $6,410 |
| 2014 | -- | $12,470 | $2,310 | $10,160 |
Source: Public Records
Map
Nearby Homes
- 4220 E 119th Place Unit B
- 11981 Bellaire St Unit D
- 4402 E 117th Ct
- 4160 E 119th Place Unit B
- 11961 Bellaire St Unit C
- 11731 Ash St
- 11901 Bellaire St Unit D
- 5080 E 120th Place
- 4875 E 117th Dr
- 5005 E 117th Ave
- 12152 Dahlia Dr
- 5160 E 120th Place
- 11725 Forest Ct
- 5211 E 119th Ct
- 12099 Forest St
- 5243 E 119th Way
- 12129 Forest St
- 12187 Fairfax St
- 5155 E 117th Dr
- 3991 E 121st Ave
- 4367 E 118th Ct
- 11841 Birch Dr
- 4376 E 118th Ct
- 4340 E 119th Way
- 4377 E 118th Ct
- 11864 Bellaire Cir
- 11866 Bellaire Cir
- 4364 E 119th Way
- 4387 E 118th Ct
- 4352 E 119th Way
- 4376 E 119th Way
- 4338 E 119th Way
- 11852 Bellaire Cir
- 4406 E 118th Ct
- 11837 Birch Dr
- 11878 Bellaire Cir
- 4380 E 119th Way
- 4407 E 118th Ct
- 11850 Bellaire Cir
- 4326 E 119th Way
Your Personal Tour Guide
Ask me questions while you tour the home.